Volume 10, Number 1—January 2004
Research
Evaluating Detection and Diagnostic Decision Support Systems for Bioterrorism Response
Dena M. Bravata*† , Vandana Sundaram*†‡, Kathryn M. McDonald*†, Wendy M. Smith*†, Herbert Szeto*†§, Mark D. Schleinitz¶#, and Douglas K. Owens*†‡
Figure 2
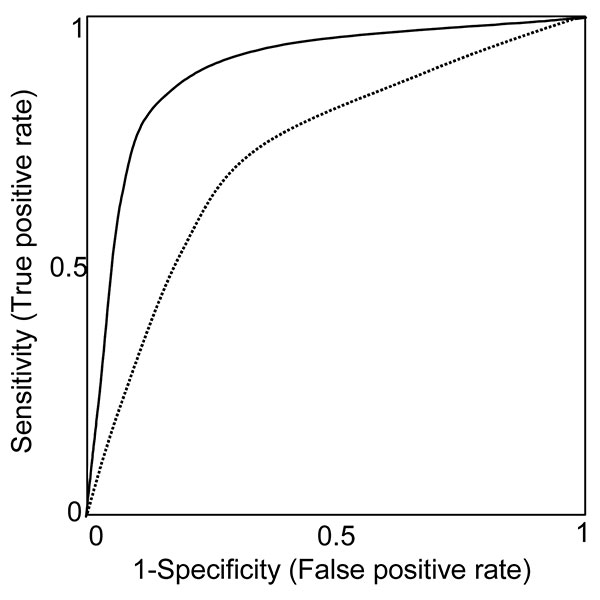
Figure 2. Receiver-operating characteristic curves (ROC). Each point along a ROC represents the trade-off in sensitivity and specificity, depending on the threshold for an abnormal test. Here, two hypothetical diagnostic tests are compared. The diagnostic test represented by the unbroken ROC curve is a better test than that represented by the broken ROC curve, as demonstrated by its greater sensitivity for any given specificity (and thus, greater area under the curve).
Page created: December 21, 2010
Page updated: December 21, 2010
Page reviewed: December 21, 2010
The conclusions, findings, and opinions expressed by authors contributing to this journal do not necessarily reflect the official position of the U.S. Department of Health and Human Services, the Public Health Service, the Centers for Disease Control and Prevention, or the authors' affiliated institutions. Use of trade names is for identification only and does not imply endorsement by any of the groups named above.