Volume 10, Number 8—August 2004
Letter
Estimating SARS Incubation Period
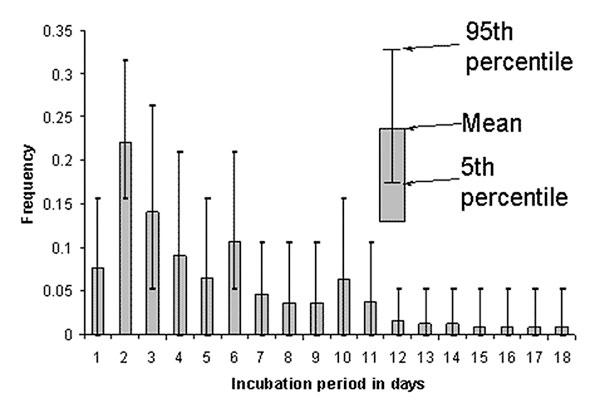
Figure 1

Figure 1. Simulation of frequency distribution of incubation period of severe acute respiratory syndrome. Data used for this simulation were obtained from Canada, Hong Kong, and the United States, for a total sample size of 19. Many of the patients included in the database had multiple possible incubation periods (see Table), resulting in the confidence intervals displayed for each day.
Page created: June 14, 2011
Page updated: June 14, 2011
Page reviewed: June 14, 2011
The conclusions, findings, and opinions expressed by authors contributing to this journal do not necessarily reflect the official position of the U.S. Department of Health and Human Services, the Public Health Service, the Centers for Disease Control and Prevention, or the authors' affiliated institutions. Use of trade names is for identification only and does not imply endorsement by any of the groups named above.