Volume 13, Number 8—August 2007
Letter
Ecoregional Dominance in Spatial Distribution of Avian Influenza (H5N1) Outbreaks
Appendix Figure

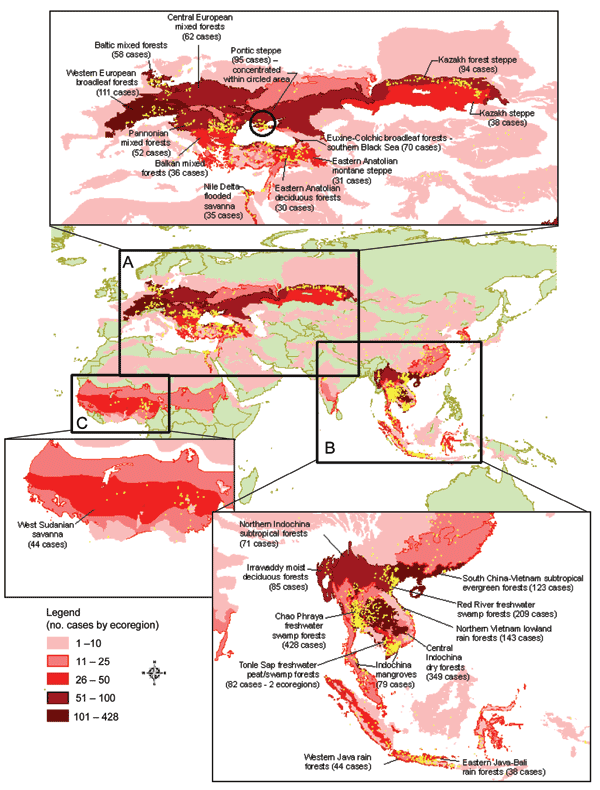
Appendix Figure. Twenty-five ecoregions with large numbers of avian influenza cases (November 2003-November 2006). A) Eurasia; B) Southeast Asia; C) Africa. Yellow regions are composed of aggregated dots representing individual cases.
Page created: June 30, 2010
Page updated: June 30, 2010
Page reviewed: June 30, 2010
The conclusions, findings, and opinions expressed by authors contributing to this journal do not necessarily reflect the official position of the U.S. Department of Health and Human Services, the Public Health Service, the Centers for Disease Control and Prevention, or the authors' affiliated institutions. Use of trade names is for identification only and does not imply endorsement by any of the groups named above.