Volume 14, Number 11—November 2008
Dispatch
Shiga Toxin–producing Escherichia coli Serogroups in Food and Patients, Germany
Figure
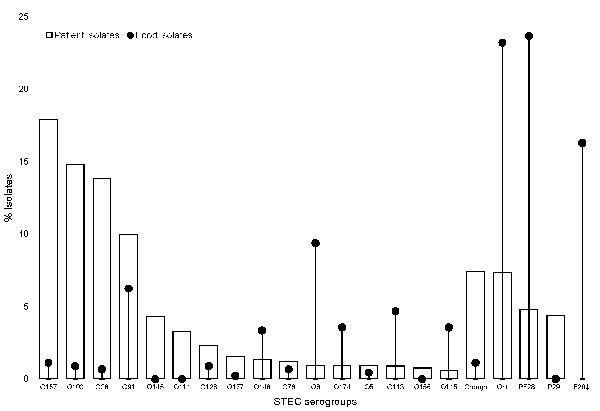
Figure. Proportion of Shiga toxin–producing Escherichia coli (STEC) serogroups identified in patients during a laboratory-based sentinel surveillance program (1999–2004) compared with STEC from food (1996–2004), Germany. *Comprises 28 serogroups that each accounted for <0.5% of patient isolates and were also identified in food isolates (O2, O4, O6, O15, O22, O23, O30, O38, O40, O55, O74, O84, O87, O88, O101, O102, O104, O110, O112, O119, O120, O121, O136, O148, O163, O171, O178, O179). †Comprises 29 serogroups that each accounted for <0.5% of patient isolates but were not identified in food isolates (O1, O7, O9, O12, O14, O17, O18, O25, O51, O60, O69, O70, O71, O75, O77, O78, O80, O86, O90, O93, O98, O106, O117, O118, O150, O154, O165, O167, O181). ‡Comprises 20 serogroups identified in food isolates only (O11, O21, O27, O36, O46, O56 O59, O62, O79, O82, O100, O109, O116, O126, O130, O141, O153, O166, O172, O176).