Volume 14, Number 3—March 2008
Research
Rescinding Community Mitigation Strategies in an Influenza Pandemic
Victoria J. Davey*† and Robert J. Glass‡
Figure 2
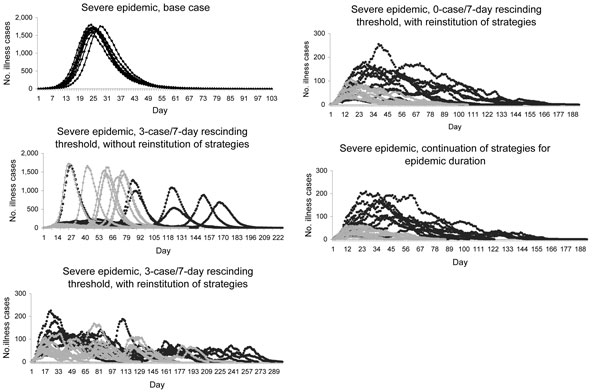
Figure 2. Severe epidemic (no. illness cases in a community of 10,000 by day) using 10 randomly selected simulations from 100 conducted for each scenario. Top panel shows unmitigated base case epidemic curves. Remaining panels show child sequestering strategy (dark lines) and community sequestering strategy (light lines). Each mitigation strategy is implemented at 90% compliance. (Note change in y-axis scale.)
Page created: July 07, 2010
Page updated: July 07, 2010
Page reviewed: July 07, 2010
The conclusions, findings, and opinions expressed by authors contributing to this journal do not necessarily reflect the official position of the U.S. Department of Health and Human Services, the Public Health Service, the Centers for Disease Control and Prevention, or the authors' affiliated institutions. Use of trade names is for identification only and does not imply endorsement by any of the groups named above.