Volume 15, Number 1—January 2009
Research
Selection Tool for Foodborne Norovirus Outbreaks
Figure 2
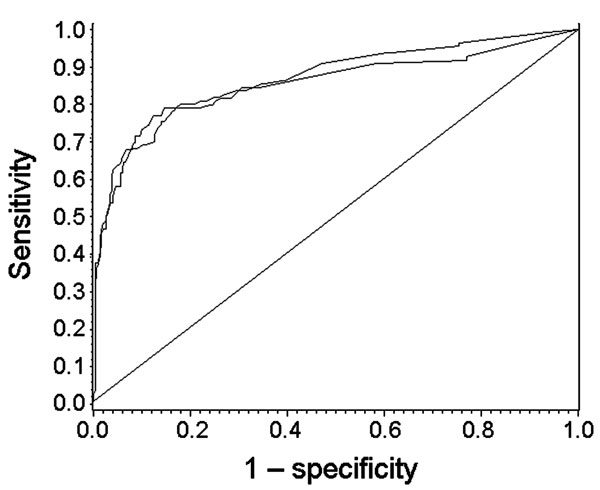
Figure 2. Receiving operator characteristics curves for distinction of foodborne outbreaks from person-to-person outbreaks in the training sample (upper graph, 435/439 records used) and in the validation sample (lower graph, 432/439 records used). The area under curve in the validation sample was 0.90, indicating good performance of the model.
1Persons contributing and countries represented: H. Vennema, E. Duizer (the Netherlands); D. Brown, B. Adak, J. Gray, J. Harris, M. Iturriza (United Kingdom); K.-H. von Bonsdorff, L. Maunula, M. Kuusi (Finland); B. Böttiger, K. Mølbak, G. Falkenhorst, C. Johnsen (Denmark); K.-O. Hedlund, Y. Andersson, M. Thorhagen, M. Lysén, M. Hjertqvist (Sweden); P. Pothier, E. Kohli, K. Balay, J. Kaplon, G. Belliot, S. Le Guyader (France); A. Bosch, A. Dominguez, J. Buesa, A. Sanchez Fauquier, G. Hernández-Pezzi (Spain); G. Szücs, G. Reuter, K. Krisztalovics (Hungary); M. Poljsak-Prijatelj, D. Barlic-Maganja, A. Hocevar Grom (Slovenia); F. Ruggeri, I. Di Bartolo (Italy); E. Schreier, K. Stark, J. Koch, M. Höhne (Germany); M. Lynch, B. Foley, P. McKeown, S. Coughlan (Ireland); K. Vainio, T. Bruun (Norway).