Volume 16, Number 6—June 2010
Letter
Human Anaplasmosis and Anaplasma ovis Variant
Figure
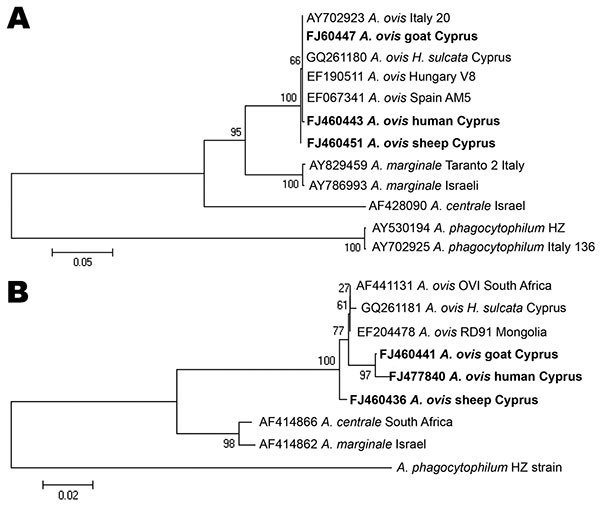
Figure. Evolutionary trees based on major surface protein 4 (A) and heat shock protein 60 (B) genes sequences of Anaplasma phagocytophilum, A. marginale, and A. ovis. Evolutionary history was inferred by using the neighbor-joining method. H. sulcata; Haemaphysalis sulcata. A) Optimal tree (branch length = 0.87919908) is shown. Percentages of replicate trees in which the associated taxa clustered together in the bootstrap test (500 replicates) are shown. B) Optimal tree (branch length = 0.34047351) is shown. Percentages of replicate trees in which the associated taxa clustered together in the bootstrap test (1,000 replicates) are shown. Trees are drawn to scale, with branch lengths in the same units as those of the evolutionary distances used to infer the phylogenetic tree. Evolutionary distances were computed by using the Kimura 2-parameter method. Strains detected in Cyprus are indicated in boldface. Scale bars indicate number of base substitutions per site.