Volume 8, Number 2—February 2002
Research
Antibiotic Resistance Patterns of Bacterial Isolates from Blood in San Francisco County, California, 1996-1999
Susan S. Huang*† , Brian J. Labus†‡, Michael C. Samuel†‡, Dairian T. Wan†, and Arthur L. Reingold†‡
Figure 2
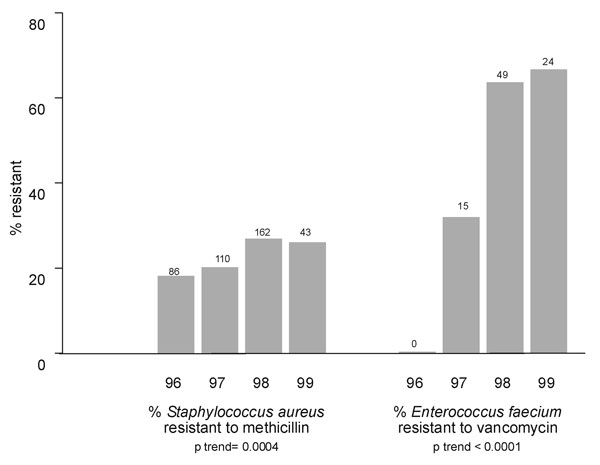
Figure 2. Increase in percentage of Staphylococcus aureus isolates resistant to methicillin and increase in percent of Enterococcus faecium resistant to vancomycin on a yearly basis from 1996 through the first quarter of 1999. Number of isolates per year, regardless of susceptibility, appears above each bar. Tests of trend showed significant increases in percent resistance for both organisms.
Page created: July 14, 2010
Page updated: July 14, 2010
Page reviewed: July 14, 2010
The conclusions, findings, and opinions expressed by authors contributing to this journal do not necessarily reflect the official position of the U.S. Department of Health and Human Services, the Public Health Service, the Centers for Disease Control and Prevention, or the authors' affiliated institutions. Use of trade names is for identification only and does not imply endorsement by any of the groups named above.