Volume 8, Number 6—June 2002
Research
Defining and Detecting Malaria Epidemics in the Highlands of Western Kenya
Simon I. Hay*† , Milka Simba†, Millie Busolo‡, Abdisalan M. Noor†, Helen L. Guyatt*†, Sam A. Ochola‡, and Robert W. Snow*†‡
Figure 2
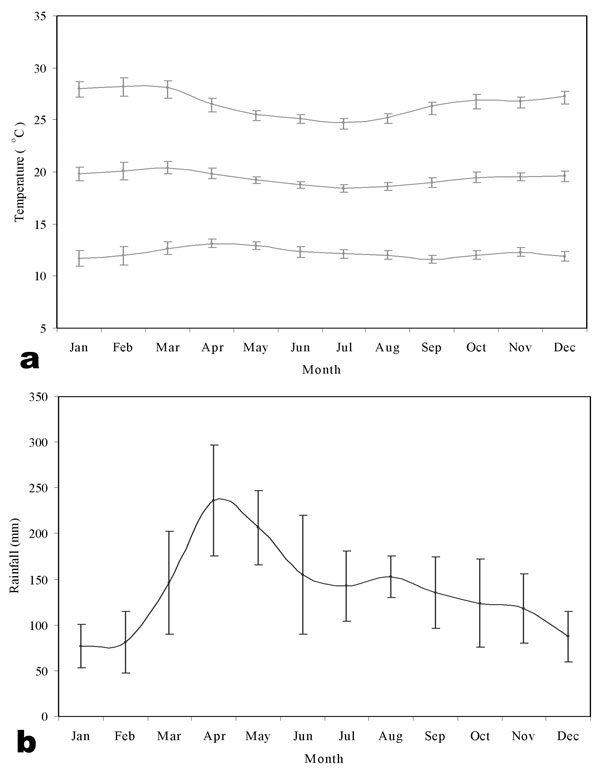
Figure 2. Meteorologic time-series for study hospitals. Temperature and rainfall profiles for a synoptic (1980-1995). (a) minimum (bottom), mean (middle), and maximum (top) monthly temperatures (°C); (b) average total monthly rainfall (mm). The error bars denote standard errors of the calculated month means.
Page created: July 16, 2010
Page updated: July 16, 2010
Page reviewed: July 16, 2010
The conclusions, findings, and opinions expressed by authors contributing to this journal do not necessarily reflect the official position of the U.S. Department of Health and Human Services, the Public Health Service, the Centers for Disease Control and Prevention, or the authors' affiliated institutions. Use of trade names is for identification only and does not imply endorsement by any of the groups named above.