Volume 8, Number 9—September 2002
Research
Impact of El Niño/Southern Oscillation on Visceral Leishmaniasis, Brazil
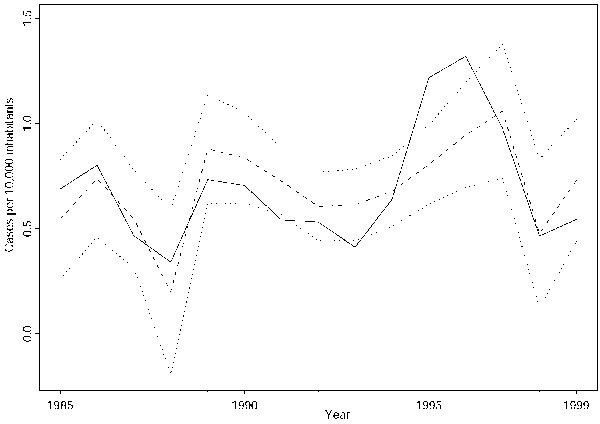
Figure 3

Figure 3. Result of the regression model. The figure represents the annual number of cases of visceral leishmaniasis per 10,000 inhabitants during 1985 to 1999 (solid line), the fitted regression model (broken line), and the corresponding 95% confidence limits (dotted lines).
Page created: July 16, 2010
Page updated: July 16, 2010
Page reviewed: July 16, 2010
The conclusions, findings, and opinions expressed by authors contributing to this journal do not necessarily reflect the official position of the U.S. Department of Health and Human Services, the Public Health Service, the Centers for Disease Control and Prevention, or the authors' affiliated institutions. Use of trade names is for identification only and does not imply endorsement by any of the groups named above.