Volume 8, Number 9—September 2002
Research
Impact of El Niño/Southern Oscillation on Visceral Leishmaniasis, Brazil
Cite This Article
Citation for Media
Abstract
We used time-series analysis and linear regression to investigate the relationship between the annual Niño-3 index from 1980 to 1998 and the annual incidence of visceral leishmaniasis (VL) in the State of Bahia, Brazil, during 1985–1999. An increase in VL incidence was observed in the post-El Niño years 1989 (+38.7%) and 1995 (+33.5%). The regression model demonstrates that the previous year’s mean Niño-3 index and the temporal trend account for approximately 50% of the variance in the annual incidence of VL in Bahia. The model shows a robust agreement with the real data, as only the influence of El Niño on the cycle of VL was analyzed. The results suggest that this relationship could be used to predict high-risk years for VL and thus help reduce health impact in susceptible regions in Brazil.
Visceral leishmaniasis (VL) is a widespread parasitic disease in the Old and New Worlds, with a global incidence of 500,000 new human cases each year. VL is the most severe clinical form within the leishmaniasis complex, which is endemic in 88 countries with an at-risk population of approximately 350 million (1). In Brazil, VL affects both humans and animals and is caused by Leishmania chagasi, a flagellate protozoan transmitted by the sand fly Lutzomyia longipalpis (2). The disease occurs mainly in malnourished young children and is frequently fatal if untreated (3,4). Periodic epidemic waves of VL, observed mainly in northeastern Brazil, have been associated with human migrations to urban areas after long periods of drought (5–8). In this region, El Niño events are related to unusually dry conditions, widespread food scarcity, and migration (9–11). El Niño periods in 1982–1983, 1986–1987, 1991–1993, and 1997–1998 coincided with long droughts recorded by the Superintendence for the Development of the Northeast Brazil (SUDENE). Data from the State of Bahia, analyzed in our study, show that 247 municipalities were affected during the strong El Niño of 1997–98, mainly in the semi-arid inland region, where approximately 200,000 people were included in SUDENE’s emergency program, at a cost of an estimated US $62 million.
El Niño is the strongest interannual climate fluctuation worldwide, characterized by a large-scale warming of the eastern and central equatorial Pacific Ocean. El Niño (also known as El Niño/Southern Oscillation) can be understood as the warm phase of an irregular cycle with an average frequency of 3–4 years. Each event typically lasts for approximately a year, with the peak warming in boreal winter (December–February) and the following spring (March–May) (12). Some studies provide strong evidence of the relationship between El Niño and increased epidemic risk of vector-borne diseases in distinct regions throughout the world (13,14). This observation is especially true for malaria (15–18). We report the early results of our analysis of the relationship between the El Niño cycle and VL in Brazil.
The State of Bahia (pop. 13,093,243, in the 2000 census) is situated on the northeast Atlantic coast of Brazil. Its area is 567,295 km2, divided into 415 municipalities. The annual number of VL cases from 1985 to 1999 was obtained from the Public Health Secretary of the State of Bahia. In this period in Bahia, 12,413 cases of VL were reported by using a passive case-detection procedure. Diagnosis was based on clinical and epidemiologic features, confirmed by immunofluorescence assay or detection of parasites by examination of smears of bone marrow, lymph node, or splenic aspirate.
For our analysis, we used the mean monthly Niño-3 index for the years 1980 to 1998. This index is the tropical Pacific sea surface temperature (SST) anomaly averaged over 150°W–90°W, 5°N–5°S, obtained from the Hadley Centre dataset (19). To evaluate the relationship between El Niño and VL and to quantify the delay of its possible impact, we calculated the cross-correlation function between the annual incidences of VL per 10,000 inhabitants from 1985 to 1999 and the 12-month moving average of the mean monthly Niño-3 index. The linear temporal trend was removed from both variables before analysis. Additionally, to model the observed dependence, we calculated a linear regression between the annual incidence of VL, the year (to consider the linear temporal trend), and the mean annual Niño-3 index 12 months previously.
Figure 1
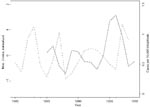
Figure 1. The Niño-3 index and the incidence of VL in the State of Bahia, Brazil, on a yearly basis. The broken line is the normalized mean annual Nino-3 index, 1980–1998. The solid...
We observed that, despite the wide territorial area of Bahia and the complex epidemiologic nature of VL, the cycle of the annual incidence appears to be narrowly associated with both the frequency and duration of El Niño episodes. Low incidence levels coincide with the occurrence of El Niño, and an increase in incidence occurs after such climatic events (Figure 1). We found extreme increases of the incidence in relation to the 5-year moving average for the years 1989 (+38.7%) and 1995 (+33.5%).
Figure 2

Figure 2. Cross-correlation function between the annual incidences of visceral leishmaniasis from 1985 to 1999 and the 12-month moving average of the mean monthly Niño-3 index (solid line). Broken lines are the corresponding...
The cross-correlation function between the annual incidences of VL and the 12-month moving average of the mean monthly Niño-3 index has its strongest negative correlation at a lag of 12 months and its strongest positive correlation at a lag of 36 months (Figure 2). The positive correlation may, in part, result from a broad minimum of the autocorrelation function of the mean monthly Niño-3 index at lags from 16 to 28 months, with autocorrelation values of -0.54 < correlation coefficient (r) < -0.45.
Figure 3

Figure 3. Result of the regression model. The figure represents the annual number of cases of visceral leishmaniasis per 10,000 inhabitants during 1985 to 1999 (solid line), the fitted regression model (broken line),...
The results of the regression model (root square error [RSE] = 0.209, adjusted coefficient of determination [adj. R2] = 0.465, F test with 2 and 12 degrees of freedom [F2;12] = 7.081, p = 0.009 demonstrate that the mean Niño-3 index 12 months previously and the temporal trend can account for approximately 50% of the variance in the annual incidence of VL in Bahia (Figure 3). The model shows a robust agreement with the real data, considering that only the influence of El Niño on the variance of VL incidence was analyzed.
Our results show that El Niño episodes are related to variation in the annual incidence of VL in the State of Bahia and suggest that an El Niño–based early warning system for VL may help reduce the health impact of the disease in susceptible regions in Brazil. According to our results, the annual incidence of VL in Bahia tends to reach its lowest level in the first year after El Niño episodes and begins to increase in the second year after El Niño. The delay of this correlation pattern is unusual in light of the well-studied association between malaria and El Niño reported in different regions of the world. Increases in malaria incidence have been reported to accompany El Niño episodes or occur in the year immediately following such episodes (15–18).
Because of the multifactorial interactions involved in this complex system, a simple deterministic explanation for the interannual correlation between El Niño and VL is not possible. However, some climatic and epidemiologic behaviors related to VL could be helpful in drafting a preliminary assumption about pathways by which El Niño can affect the temporal distribution pattern of the disease. In the New World, >90% of VL cases have been reported in Brazil, mainly in the semi-arid northeast region (2,20), where dry and rainy seasons are clearly defined. Furthermore, in this region, evidence indicates that the population density of the sand fly vector is low during the dry season and increases after the end of the rainy season (December–April), reaching its highest density level around May (5,21). The resulting increase in transmission intensity during this seasonal peak of vector density leads to an increase in the reported incidence after this period (4,5,21). In the semi-arid region of Bahia, El Niño episodes coincide with the rainy season and negate its effect, causing a prolonged drought by connecting the previous dry season, the period of El Niño, and the subsequent dry season. We hypothesize that, in view of the negative influence of dry conditions on the vector density, the long droughts triggered by El Niño events could be expected to be accompanied by prolonged low vector density and low transmission intensity. These exceptional circumstances most likely contribute to a gradual increase in the potential risk of some related epidemiologic factors, such as waning herd immunity, increase in the susceptible population in the endemic areas (as a result of new births and nonimmune immigrants), and displacement of human and animal carriers to regions with populations that lack a protective immunity (4,20). Drought-related food scarcity and growing malnutrition also increase the susceptibility to VL within these risk populations (4,22).
The rainy season at the beginning of the first year after El Niño is followed by an increase in vector density (around May), which triggers a severe increase in infection rate in high-risk populations. However, the incubation period (2–6 months) (23), added to the time from the onset of VL symptoms until diagnosis of the disease (approximately 3 months, according to data from the Federal Health Foundation of Bahia [data not shown]), shifts the reporting of most new cases into the second year after El Niño. Although this preliminary assumption provides a plausible explanation of the lag time and intensity of the teleconnection pattern between El Niño and VL cycle in Bahia, the occurrence of distinct climate and vector seasonality patterns on the regional level could lead to differences in the lag time previously discussed.
In accordance with our assumption, the divergent regression fits of the model observed for the years 1991, 1993, 1995, and 1996 most likely reflect the influence of the exceptionally long El Niño period from 1991 to 1993, which led to a lasting reduction in transmission intensity. However, in accordance with our assumption, the annual incidence of VL increased from 1994 to 1996. The divergent regression fits observed for the years 1995 and 1996 might have been caused by the sum of two factors: the critical increase in the related risk factors following a longer El Niño episode and improvement of the surveillance system. The latter occurred in 1994, when new endemic areas were included. This expanded surveillance probably facilitated better reporting of this epidemic phase of the VL cycle in Bahia. However, the low incidence reported for 1997 and 1998 (El Niño period) shows a reduced impact of this new system on the detection of new VL cases. Statistically based forecast models also failed to predict the evolution of this climatic anomaly during 1990–1993 in northeast Brazil (11). Within our limited time-series of VL data, only one longer El Niño period is included. Indeed, our model underestimates the intensity of the impact of this atypical El Niño event on the occurrence of VL. The real impact of this modified surveillance system can only be evaluated through a comparative analysis with future data.
The extreme changes in the annual incidence pattern of VL associated with the atypical occurrence of El Niño during 1991–1993 do, however, provide a possible example of the potential impact of future variations of the El Niño cycle on public health. This observation is especially interesting given the expected rising frequency of El Niño following the continuous increase of greenhouse-gas concentrations in the atmosphere (24).
The results presented here provide the first evidence of the relationship between the El Niño cycle and VL. Greater global understanding of this complex relationship, particularly of the impact of El Niño on the population dynamics of humans, animal hosts, and sand fly vectors, could provide additional tools to predict epidemic risk. The ability to forecast VL on the basis of El Niño activity about 12 months before outbreaks could permit preventive improvements on public health infrastructure, including access to financial resources, technical knowledge, active disease surveillance, and targeted vector control to reduce the risk of the increased transmission. Such forecasts would reduce disease and death from visceral leishmaniasis in susceptible regions.
Dr. Franke is parasitologist and professor of environmental science at the School of Veterinary Medicine, Federal University of Bahia, Brazil. His research interests focus on the ecoepidemiology of cutaneous and visceral leishmaniasis.
Acknowledgments
We thank the Public Health Secretary of the State of Bahia for making available the data sets used in this study. We also thank Martin Hugh-Jones for valuable comments on the manuscript and Hartmut Schlüter for support.
The Alexander von Humboldt Foundation provided fellowship support for Carlos Roberto Franke (III-ERSX-BRA/1067633).
References
- Desjeux P. Leishmaniasis, public health and control. Clin Dermatol. 1996;14:417–23. DOIPubMedGoogle Scholar
- Grimaldi G Jr, Tesh RB, McMahon-Pratt D. A review of the geographic distribution and epidemiology of leishmaniasis in the New World. Am J Trop Med Hyg. 1989;41:687–725.PubMedGoogle Scholar
- Evans TG, Teixeira MJ, McAuliffe IT, Vasconcelos IAB, Vasconcelos AW, Sousa AQ, Epidemiology of visceral leishmaniasis in northeast Brazil. J Infect Dis. 1992;166:1124–32.PubMedGoogle Scholar
- Badaró R, Jones TC, Lorenço R, Cerf BJ, Sampaio D, Carvalho EM, A prospective study of visceral leishmaniasis in an endemic area of Brazil. J Infect Dis. 1986;154:639–49.PubMedGoogle Scholar
- Sherlock IA. Ecological interactions of visceral leishmaniasis in the State of Bahia, Brazil. Mem Inst Oswaldo Cruz. 1996;91:671–83. DOIPubMedGoogle Scholar
- Cunha S, Freire M, Eulalio C, Cristovao J, Netto E, Johnson WD Jr, Visceral leishmaniasis in a new ecological niche near a major metropolitan area of Brazil. Trans R Soc Trop Med Hyg. 1995;89:155–8. DOIPubMedGoogle Scholar
- Costa CHN, Pereira HF, Araújo MV. Epidemia de leishmaniose visceral no Estado do Piauí, Brasil, 1980–1986. Rev Saude Publica. 1990;24:361–72.PubMedGoogle Scholar
- Nascimento MDSB, Nascimento SB, Costa JML, Fiori BIP, Viana GMC, Filho MSG, Aspectos epidemiológicos determinantes na manutenção da leishmaniose visceral no Estado do Maranhão, Brasil. Rev Soc Bras Med Trop. 1996;29:233–40.PubMedGoogle Scholar
- Hastenrath S, Heller L. Dynamics of climatic hazards in north-east Brazil. Q J R Meteorol Soc. 1977;103:77–92. DOIGoogle Scholar
- Hastenrath S. Recent advances in tropical climate prediction. J Clim. 1995;8:1519–32. DOIGoogle Scholar
- Rao VB, Hada K, Herdies DL. On the severe drought of 1993 in north-east Brazil. Int J Climatol. 1995;15:697–704. DOIGoogle Scholar
- Philander SGH. El Niño, La Niña, and the Southern Oscillation. San Diego: Academic Press; 1990.
- Nicholls N. El Niño-Southern Oscillation and vector-borne disease. Lancet. 1993;342:1284–5. DOIPubMedGoogle Scholar
- Barreras R, Grillet ME, Rangel Y, Berti J, Aché A. Temporal and spatial patterns of malaria reinfection in northeastern Venezuela. Am J Trop Med Hyg. 1999;61:784–90.PubMedGoogle Scholar
- Bouma MJ, van der Kaay HJ. El Niño Southern Oscillation and the historic malaria epidemics on the Indian subcontinent and Sri Lanka: an early warning system for future epidemics? Trop Med Int Health. 1996;1:86–96. DOIPubMedGoogle Scholar
- Bouma MJ, Dye C. Cycles of malaria associated with El Niño in Venezuela. JAMA. 1997;278:1772–4. DOIPubMedGoogle Scholar
- Bouma MJ, Poveda G, Rojas W, Chavasse D, Quiñones M, Cox J, Predicting high-risk years for malaria in Colombia using parameters of El Niño Southern Oscillation. Trop Med Int Health. 1997;2:1122–7. DOIPubMedGoogle Scholar
- Folland CK, Parker DE, Colman AW. Large scale modes of ocean surface temperature since the late nineteenth century. In: Navarra A, editor. Beyond El Niño. Berlin: Springer-Verlag; 1999. p. 73–102.
- Arias JR, Monteiro PS, Zincker F. The reemergence of visceral leishmaniasis in Brazil. Emerg Infect Dis. 1996;2:145–6.PubMedGoogle Scholar
- Deane LM, Deane MP. Visceral leishmaniasis in Brazil: geographical distribution and transmission. Rev Inst Med Trop São Paulo 1962;4:198–212.Cerf BJ, Jones TC, Badaró R, Sampaio D, Teixeira R, Johnson WD Jr. Malnutrition as a risk factor for severe visceral leishmaniasis. J Infect Dis. 1987;156:1030–2.PubMedGoogle Scholar
- Cerf BJ, Jones TC, Badaró R, Sampaio D, Teixeira R, Johnson WD Jr. J Infect Dis. 1987;156:1030–2.Malnutrition as a risk factor for severe visceral leishmaniasis.PubMedGoogle Scholar
- World Health Organization. Manual on visceral leishmaniasis control. Geneva; Division of Control of Tropical Diseases (WHO/LEISH/96.40): 1996
- Timmermann A, Oberhuber J, Bacher A, Esch M, Latif M, Roeckner E. Increased El Niño frequency in a climate model forced by future greenhouse warming. Nature. 1999;398:694–7. DOIGoogle Scholar
Figures
Cite This ArticleTable of Contents – Volume 8, Number 9—September 2002
| EID Search Options |
|---|
|
|
|
|
|
|
Please use the form below to submit correspondence to the authors or contact them at the following address:
Christoph Staubach, Federal Research Centre for Virus Diseases of Animals, Institute of Epidemiology, Seestr. 55, D-16868 Wusterhausen, Germany; fax: +49 33979 80200;
Top