Volume 9, Number 1—January 2003
Research
Cost Effectiveness of a Potential Vaccine for Human papillomavirus
Gillian D. Sanders* and Al V. Taira*
Figure 2
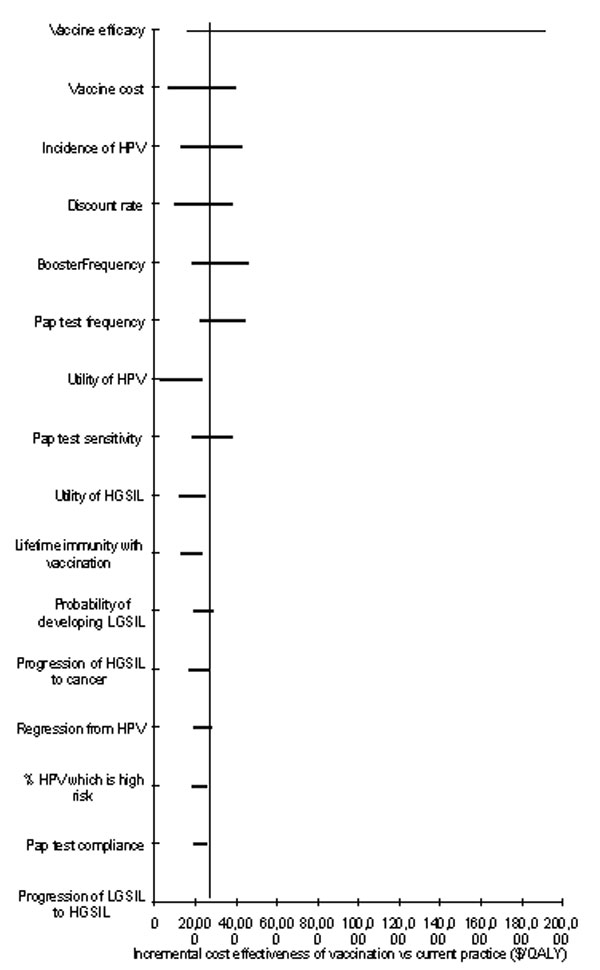
Figure 2. Sensitivity analysis. Tornado diagram representing the incremental cost-effectiveness ratios of one-way sensitivity analysis on the vaccination strategy compared to current practice. The vertical line represents the incremental cost-effectiveness ratio under base-case conditions.
Page created: December 07, 2010
Page updated: December 07, 2010
Page reviewed: December 07, 2010
The conclusions, findings, and opinions expressed by authors contributing to this journal do not necessarily reflect the official position of the U.S. Department of Health and Human Services, the Public Health Service, the Centers for Disease Control and Prevention, or the authors' affiliated institutions. Use of trade names is for identification only and does not imply endorsement by any of the groups named above.