Volume 9, Number 2—February 2003
Research
Annual Mycobacterium tuberculosis Infection Risk and Interpretation of Clustering Statistics
Emilia Vynnycky* , Martien W. Borgdorff†, Dick van Soolingen‡, and Paul E.M. Fine*
Figure 6
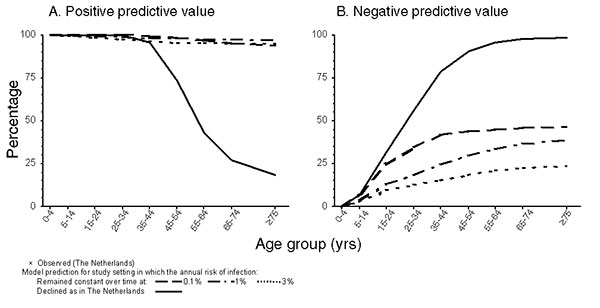
Figure 6. Summary of model predictions of the A) positive predictive values of clustering (proportion of cases who are in a cluster who have been infected or reinfected <5 years before onset) and B) negative predictive values of clustering (proportion of cases who are not in a cluster who are experiencing disease as a result of infection or reinfection acquired > 5 years before onset) in different age groups in the Netherlands and in settings in which the annual risk for infection has remained unchanged over time at 0.1%, 1%, and 3%.
Page created: June 08, 2011
Page updated: June 08, 2011
Page reviewed: June 08, 2011
The conclusions, findings, and opinions expressed by authors contributing to this journal do not necessarily reflect the official position of the U.S. Department of Health and Human Services, the Public Health Service, the Centers for Disease Control and Prevention, or the authors' affiliated institutions. Use of trade names is for identification only and does not imply endorsement by any of the groups named above.