Volume 10, Number 1—January 2004
Research
Respiratory and Urinary Tract Infections, Arthritis, and Asthma Associated with HTLV-I and HTLV-II Infection
Figure
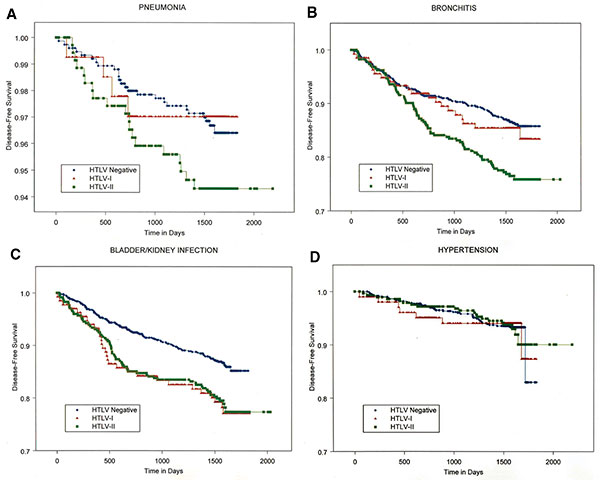
Figure. Kaplan-Meier survival curves showing disease-free survival for one noninfectious and three infectious diseases, by human T-lymphotropic virus (HTLV) status, through visits 2 and 3 of prospective observation. HTLV-I–infected (triangles) and HTLV-II–infected (squares) participants are compared to HLTV-seronegative participants (diamonds), respectively. Panels are as follows: A) pneumonia; B) acute bronchitis; C) bladder or kidney infection; and D) hypertension. The vertical axis scale has been compressed because of the lower overall incidence of pneumonia.
Page created: December 21, 2010
Page updated: December 21, 2010
Page reviewed: December 21, 2010
The conclusions, findings, and opinions expressed by authors contributing to this journal do not necessarily reflect the official position of the U.S. Department of Health and Human Services, the Public Health Service, the Centers for Disease Control and Prevention, or the authors' affiliated institutions. Use of trade names is for identification only and does not imply endorsement by any of the groups named above.