Volume 10, Number 11—November 2004
Research
Evaluating Human Papillomavirus Vaccination Programs
Figure 2

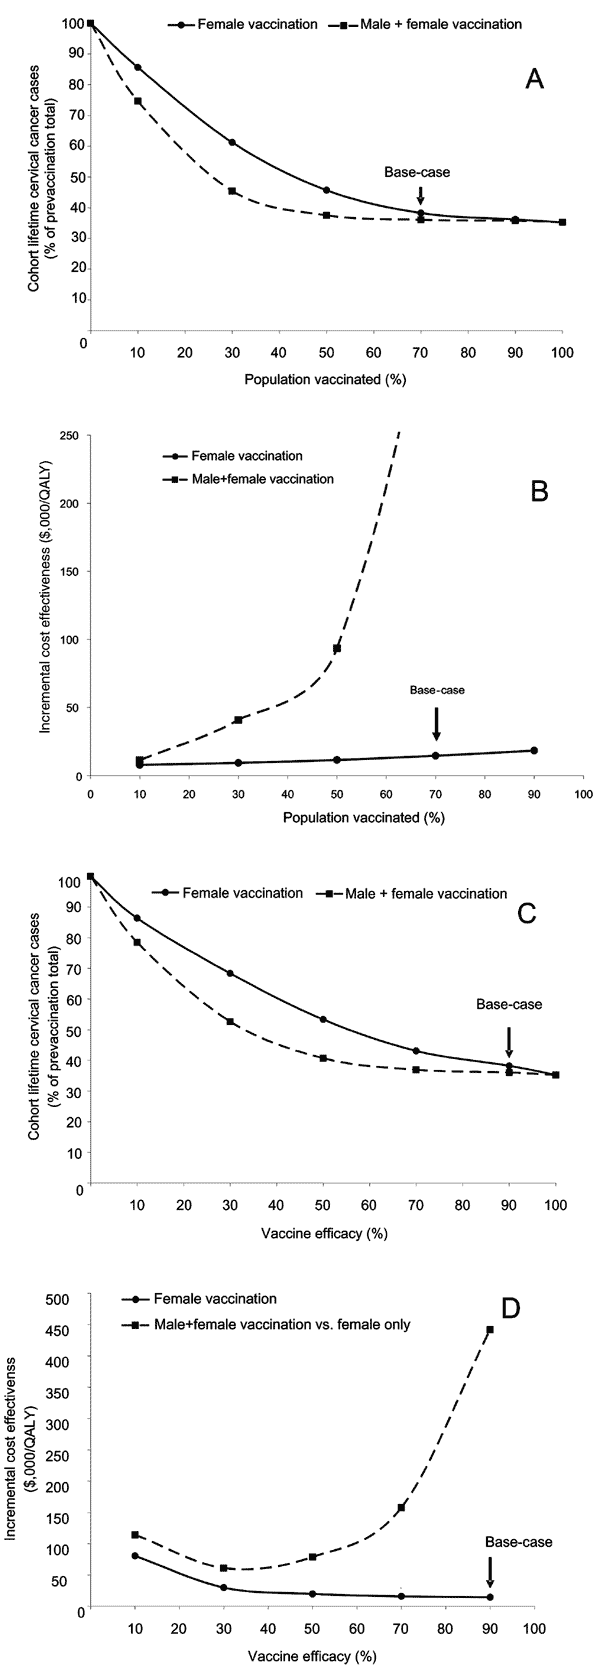
Figure 2. . A) Vaccine penetration scenario. Relationship between percentage of the population receiving the vaccine and the number of lifetime cervical cancer cases. The solid line represents a female-only vaccination strategy. The dashed line represents a strategy of vaccinating both sexes. The arrow indicates the base-case scenario of a female-only strategy with 70% penetration. B) Vaccine penetration scenario. Relationship between percentage of the population receiving the vaccine and program cost-effectiveness. The solid line represents the cost-effectiveness ($/quality-adjusted life-year [QALY]) of a female-only vaccination program compared to current practice. The dashed line represents the incremental cost-effectiveness of including male participants in a vaccine program compared to a female-only strategy. The arrow indicates the base-case scenario of a female-only program with 70% penetration. C) Vaccine efficacy scenario. Relationship between vaccine efficacy and the number of cohort lifetime cervical cancer cases. The solid line represents a female-only vaccination strategy. The dashed line represents a strategy of vaccinating both sexes. The arrow indicates the base-case scenario of a female-only strategy assuming 90% vaccine efficacy. D) Vaccine efficacy scenario. Relationship between vaccine efficacy and program cost-effectiveness. The solid line represents the cost-effectiveness ($/quality-adjusted life-year [QALY]) of a female-only vaccination program compared to current practice. The dashed line represents the incremental cost-effectiveness of including male participants in a vaccine program compared to a female-only strategy. The arrow indicates the base-case scenario of a female-only program at 90% vaccine efficacy.