Volume 10, Number 3—March 2004
Research
Genomic Changes of Chagas Disease Vector, South America
Francisco Panzera* , Jean Pierre Dujardin†, Paula Nicolini*, María Noel Caraccio*, Virginia Rose*, Tatiana Tellez‡, Hernán Bermúdez‡, María Dolores Bargues§, Santiago Mas-Coma§, José Enrique O’Connor§, and Ruben Pérez*
Figure 1
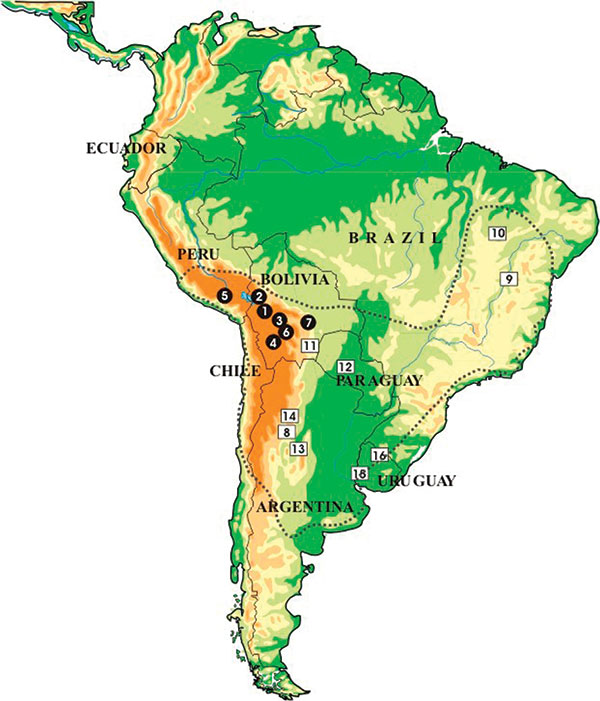
Figure 1. Location of the collection sites of individual Triatoma infestans analyzed in this study. Dotted lines indicate T. infestans distribution during the 1980s. Full circles indicate Andean samples. Open squares indicate non-Andean samples. (See number identification of each population in Tables 1–3.)
Page created: February 08, 2011
Page updated: February 08, 2011
Page reviewed: February 08, 2011
The conclusions, findings, and opinions expressed by authors contributing to this journal do not necessarily reflect the official position of the U.S. Department of Health and Human Services, the Public Health Service, the Centers for Disease Control and Prevention, or the authors' affiliated institutions. Use of trade names is for identification only and does not imply endorsement by any of the groups named above.