Volume 10, Number 5—May 2004
Research
Laboratory Diagnosis of SARS
Paul K.S. Chan* , Wing-Kin To†, King-Cheung Ng*, Rebecca K. Y. Lam*, Tak-Keung Ng†, Rickjason C. W. Chan* , Alan Wu*, Wai-Cho Yu†, Nelson Lee*, David S. C. Hui*, Sik-To Lai†, Ellis K. L. Hon*, Chi-Kong Li*, Joseph J. Y. Sung*, and John S. Tam*
Figure 2
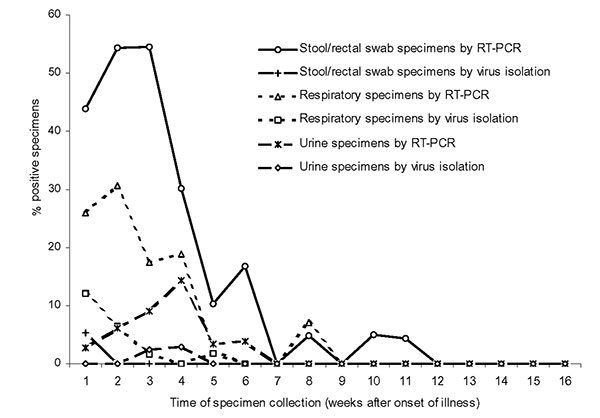
Figure 2. Positive rates of specimen groups according to time of collection from onset of symptoms. The number of specimens tested is shown in Table 1.
Page created: February 22, 2011
Page updated: February 22, 2011
Page reviewed: February 22, 2011
The conclusions, findings, and opinions expressed by authors contributing to this journal do not necessarily reflect the official position of the U.S. Department of Health and Human Services, the Public Health Service, the Centers for Disease Control and Prevention, or the authors' affiliated institutions. Use of trade names is for identification only and does not imply endorsement by any of the groups named above.