Volume 10, Number 7—July 2004
Research
Recombinant Viruses and Early Global HIV-1 Epidemic
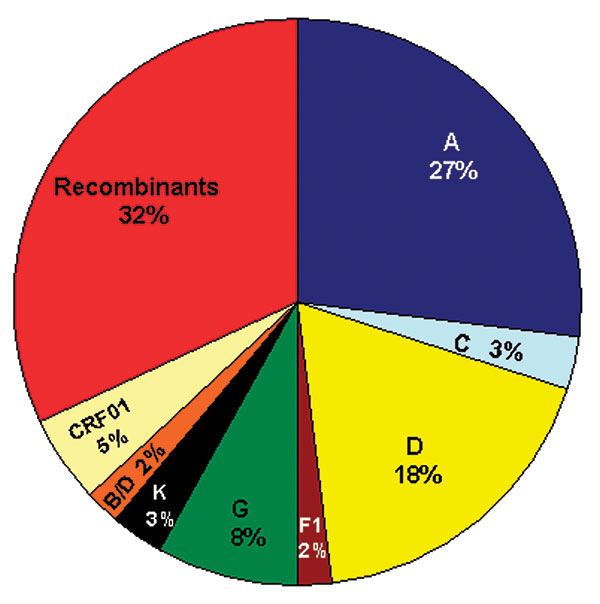
Figure 2

Figure 2. Distribution of subtypes and recombinant viruses. The pie chart represents 66 strains for which sequences from at least 2–3 gene regions were available for comparison; the subtypes in the pie chart represent concordant phylogenies suggestive of possible “pure” subtypes; the CRF01 and unique recombinant viruses are indicated in the pie chart. Table 2 summarizes subtypes of unique recombinant viruses.
Page created: January 27, 2011
Page updated: January 27, 2011
Page reviewed: January 27, 2011
The conclusions, findings, and opinions expressed by authors contributing to this journal do not necessarily reflect the official position of the U.S. Department of Health and Human Services, the Public Health Service, the Centers for Disease Control and Prevention, or the authors' affiliated institutions. Use of trade names is for identification only and does not imply endorsement by any of the groups named above.