Volume 10, Number 8—August 2004
Research
Antimicrobial Drug Use and Methicillin-resistant Staphylococcus aureus, Aberdeen, 1996–2000
Dominique L. Monnet*, Fiona M. MacKenzie† , José María López-Lozano‡, Arielle Beyaert§, Máximo Camacho§, Rachel Wilson†, David Stuart†, and Ian M. Gould†
Figure 2
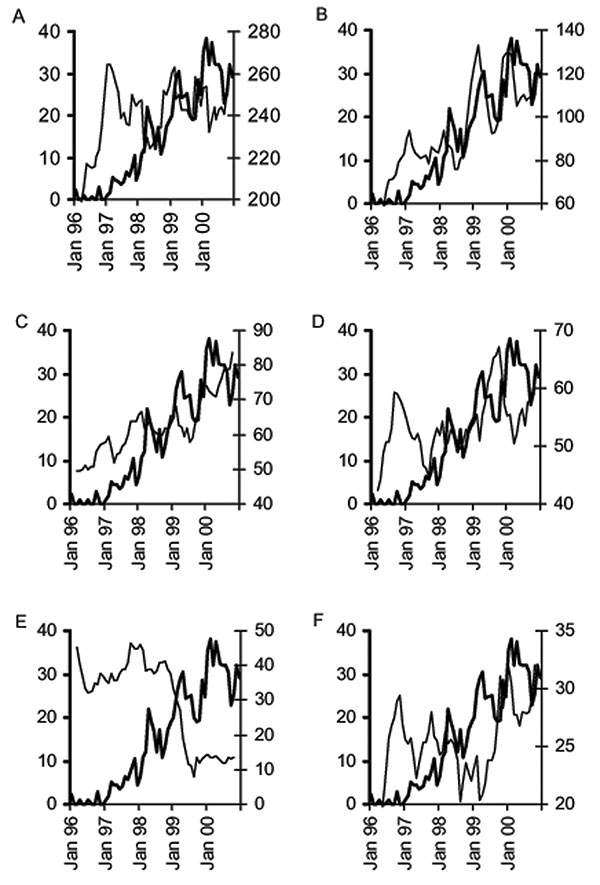
Figure 2. Examples of graphic exploration of the relationship between the monthly % methicillin-resistant Staphylococcus aureus (%MRSA) and the monthly use of individual classes of antimicrobials, Aberdeen Royal Infirmary, January 1996–December 2000 (THICK LINE, %MRSA; THIN LINE, Antimicrobial use, 5-month moving average, right Y-axis); A) penicillins with β-lactamase inhibitors, B) macrolides, C) third-generation cephalosporins, D) fluoroquinolones, E) tetracyclines, and F) aminoglycosides.
Page created: March 01, 2011
Page updated: March 01, 2011
Page reviewed: March 01, 2011
The conclusions, findings, and opinions expressed by authors contributing to this journal do not necessarily reflect the official position of the U.S. Department of Health and Human Services, the Public Health Service, the Centers for Disease Control and Prevention, or the authors' affiliated institutions. Use of trade names is for identification only and does not imply endorsement by any of the groups named above.