Volume 11, Number 1—January 2005
Research
Norovirus and Foodborne Disease, United States, 1991–2000
Cite This Article
Citation for Media
Abstract
Efforts to prevent foodborne illness target bacterial pathogens, yet noroviruses (NoV) are suspected to be the most common cause of gastroenteritis. New molecular assays allow for better estimation of the role of NoV in foodborne illness. We analyzed 8,271 foodborne outbreaks reported to the Centers for Disease Control and Prevention from 1991 to 2000 and additional data from 6 states. The proportion of NoV-confirmed outbreaks increased from 1% in 1991 to 12% in 2000. However, from 1998 to 2000, 76% of NoV outbreaks were reported by only 11 states. In 2000, an estimated 50% of foodborne outbreaks in 6 states were attributable to NoV. NoV outbreaks were larger than bacterial outbreaks (median persons affected: 25 versus 15), and 10% of affected persons sought medical care; 1% were hospitalized. More widespread use of molecular assays will permit better estimates of the role of NoV illness and help direct efforts to control foodborne illness.
Foodborne infections are estimated to cause 76 million illnesses, 300,000 hospitalizations, and 5,000 deaths annually in the United States (1). Several high-profile outbreaks in the last 15 years have focused attention on the role of bacteria in severe foodborne illness (2–4) and led to serious efforts to prevent bacterial contamination of food during all levels of processing and handling—the “farm-to-fork” model. However, in more than two thirds of outbreaks of foodborne illness, no pathogen is identified (5).
Noroviruses (NoV), previously known as Norwalk-like viruses, have long been suspected to be a frequent cause of foodborne outbreaks (6–11). Until recently, diagnosis of NoV infection relied on methods that were insensitive (electron microscopy [12]), difficult to set up (serologic testing with human reagents [13]), and available only in research settings. In 1982, epidemiologic and clinical criteria were formulated to help attribute outbreaks to NoV in the absence of a simple diagnostic test (14). Despite these criteria, the absence of any routine diagnostic assay for NoV has discouraged investigations into outbreaks of suspected viral etiology and thus limited assessment of the true impact of gastroenteritis associated with these pathogens. In 2000, for example, a survey of public health professionals in Tennessee found that only 9% cited viruses as a major cause of foodborne illness (15). Not unexpectedly, therefore, of the 2,751 foodborne outbreaks reported to the Centers for Disease Control and Prevention (CDC) from 1993 to 1997, only 9 (0.3%) were confirmed as due to NoV (5).1
In the early 1990s, sensitive and simpler assays were developed to detect NoV by identifying viral RNA after reverse transcription-polymerase chain reaction (RT-PCR) (16). In 1993, RT-PCR was adopted at CDC for the routine detection of NoV (17), particularly in outbreaks in which specimens test negative for common bacteria. A number of state public health laboratories subsequently adopted similar assays or began sending specimens to CDC for NoV testing. When RT-PCR was used, a NoV was identified as the etiologic agent in 93% of outbreaks of nonbacterial gastroenteritis submitted for testing to CDC from 1997 to 2000 (18). However, this selection was of specimens from outbreaks of illness characteristic of viral infection, and they usually have already tested negative for bacteria. The selection introduces bias since it does not permit an assessment of the true relative frequency of foodborne outbreaks of NoV disease. Therefore, we analyzed data from all foodborne outbreaks (irrespective of cause) reported to CDC by state health departments from 1991 through 2000 to assess how recent application of RT-PCR techniques might have improved understanding of the relative impact and role of NoV in these outbreaks in the United States.
We used 3 related datasets: 1) all foodborne outbreaks reported to CDC from 1991 through 2000 (N = 8,271), 2) a subset of these outbreaks reported from 1998 though 2000 when surveillance was enhanced and states began to use NoV diagnostics (N = 4,072), and 3) all foodborne outbreaks reported in 2000 in 6 selected states from which supplementary data on diagnostic testing were gathered (N = 600).
Foodborne Outbreak Reports, 1991–2000
Outbreaks of foodborne disease (excluding those on cruise ships) are voluntarily reported by state health departments to CDC for inclusion in the National Foodborne Outbreak Reporting System. Whether an outbreak is classified as foodborne or not is at the discretion of the state epidemiologist. Minimum data required for registering an outbreak report include the number of persons ill and the date of onset of the first case. The determination of outbreak cause is based on CDC’s pathogen-specific guidelines (19). In 1998, the surveillance system was enhanced by annual data verification with states and solicitation of any unreported outbreaks.
We reviewed records of 8,271 foodborne outbreaks reported to CDC from 1991 through 2000. We also noted the year in which state laboratories set up the RT-PCR assay for NoV, and by cross-referencing with CDC laboratory logs, we determined whether an outbreak had been confirmed as attributable to NoV at a laboratory in a state or at CDC.
Foodborne Outbreak Reports, 1998–2000
This subset of foodborne outbreaks was selected for further analysis because, in addition to enhanced surveillance in this period, state public health laboratories had begun to test routinely for NoV, and these reports therefore included most outbreaks of confirmed NoV disease. Available variables included the laboratory-confirmed cause; clinical data (symptoms, median incubation period, median duration of illness); food vehicle; whether a foodhandler was implicated; and the number of persons exposed, ill, requiring medical attention, or hospitalized.
From January 1998 through December 2000, a total of 4,072 outbreaks were reported to CDC. We excluded 30 outbreaks involving multiple states and 10 occurring in the U.S. territories and further analyzed the remaining 4,032 outbreak reports.
To assess the differences between states in outbreak reporting and laboratory testing, each state was classified into 1 of 5 groups on the basis of the number of NoV-confirmed outbreaks that a state reported in 1998 to 2000 (>20, 10–19, 5–9, 1–4, or none reported). The proportion of reported outbreaks with a known cause and the proportion confirmed to be due to NoV were calculated for each group. The number of reported outbreaks per 100,000 population per state for these 3 years was also calculated by using U.S. Census data for 2000.
To characterize the severity of illness and the settings associated with NoV outbreaks, we selected the 305 NoV-confirmed outbreaks and analyzed those with complete information on medical care (n = 112) and setting (n = 278). We calculated the proportion of persons seeking care and the proportion hospitalized by using the number of case-patients interviewed as a denominator.
To compare the epidemiologic and clinical features of outbreaks attributed to bacteria and viruses, we selected, from the 4,032 outbreaks of gastroenteritis, a subset of 1,216 reports with complete information on the number ill, duration of illness, incubation period, and the proportion of interviewed patients who reported vomiting or fever. Of these outbreaks, 136 were attributed to NoV, 173 to bacteria, and 907 to an undetermined cause. We further compared outbreak reports with information on implicated food types (n = 608) and whether or not an ill foodhandler was thought involved by the outbreak investigators (n = 760).
Data on Specimen Screening from 6 States, 2000
Data on the pathogens screened in a single outbreak are not reported to CDC; therefore, to estimate the proportion of outbreaks that would be NoV-confirmed if collected specimens were tested routinely not only for bacteria but also for NoV, we gathered additional data on the testing of stools gathered from foodborne outbreaks in 2000 from 6 states (Georgia, Minnesota, Ohio, Florida, Maryland, New York). These states were selected because they collected stools from a large number of outbreaks and had laboratory capability to test specimens for NoV.
We applied the proportion of all outbreaks tested for NoV that were NoV-positive in each state (>1 positive specimens) to the number of outbreaks of undetermined etiology for which specimens had been gathered, had tested negative for bacteria, but had not been tested for NoV. We then added this figure to the total actual number of NoV outbreaks to estimate the proportion of all outbreaks with specimens in that state that would be attributable to NoV had specimens from all outbreaks been tested fully.
Foodborne Outbreak Reports, 1991–2000
Figure 1
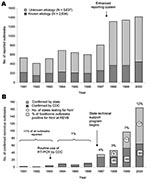
Figure 1. A) Foodborne outbreaks reported to the Centers of Disease Control and Prevention (CDC), United States, 1991–2000. B) Norovirus (NoV)-confirmed foodborne outbreaks reported to CDC, United States, 1991–2000. REVB, Respiratory and Enteric...
The number of foodborne outbreaks reported to CDC per year from 1991 to 2000 ranged from 411 outbreaks in 1992 to 1,414 in 2000, and increased markedly in 1998, when the reporting system was changed (Figure
Foodborne Outbreak Reports, 1998–2000
Of 4,032 outbreaks reported in this period of enhanced surveillance, only 1,146 (28%) were of determined cause and 2,886 (72%) were of undetermined etiology (Table
NoV Reporting
Figure 2

Figure 2. Norovirus-confirmed foodborne outbreaks by state, United States, 1998–2000 (N = 305).Years in parenthesis indicate first year a state public health laboratory developed molecular assays for norovirus (as of December 2001). *Includes...
A great disparity was observed in the reporting of NoV outbreaks. Of the 50 U.S. states and the District of Columbia, 15 (29%) reported no NoV outbreaks (Figure
We hypothesized that the proportion of outbreaks of determined cause reported in each state would be lowest in those states not reporting any NoV-confirmed outbreaks, but this hypothesis was not supported by the data. In fact, paradoxically, the 15 states that reported no NoV outbreaks in the study period determined a cause in 53% of all outbreaks, compared to 20%–45% in the 35 states that reported at least 1 NoV outbreak. The 11 states that reported >10 NoV outbreaks also reported, on average, more outbreaks per 100,000 population (2.3) compared with the 35 states that reported 0–10 NoV outbreaks (0.8–0.9). The number of NoV outbreaks reported by states, however, was not simply a function of total outbreaks reported; the percentage of NoV outbreaks of those outbreaks of determined etiology also increased significantly, from 0% to 57% (chi square for trend; p > 0.001), which suggests better outbreak investigation and testing for NoV.
Illness
Information on physician visits and hospitalization was complete in 112 (37%) of all 305 NoV outbreaks. Of 3,370 persons affected in these 112 outbreaks, 329 (10%) sought care from a physician, and 33 (1%) were hospitalized.
Setting
For 278 (91%) of the 305 NoV outbreaks where the site of food consumption or preparation was recorded, restaurants, caterers, or food outlets were associated with 108 (39%), private homes with 35 (13%), daycare facilities or schools with 27 (10%), workplace with 18 (6%), nursing homes or hospitals with 14 (5%), and other settings with 76 (27%).
Comparison of Bacterial and NoV Outbreaks
We compared selected epidemiologic and clinical features of NoV outbreaks (n = 136), bacterial outbreaks (n = 173), and outbreaks of unknown etiology (n = 907), when information was complete. Of the 173 bacterial outbreaks, 79 (46%) were attributed to Salmonella spp., 27 (16%) to Clostridium spp., 20 (12%) to Staphylococcus aureus, 19 (11%) to Shigella spp., 13 (8%) to Escherichia coli, 7 (4%) to Bacillus cereus, 6 (3%) to Campylobacter spp., and 2 (1%) to other bacterial pathogens.
NoV outbreaks were significantly larger than outbreaks of bacterial or unknown etiology (median number of cases per outbreak = 25 versus 15 and 7, respectively. Wilcoxon rank sum test: p < 0.001) (Table
The median incubation period was significantly longer in outbreaks of NoV gastroenteritis: 85% of these outbreaks featured a median incubation period >24 hours compared with 39% in outbreaks of bacterial cause and 43% in outbreaks of unknown etiology. This finding is largely explained by outbreaks caused by preformed toxins from certain bacteria (S. aureus, Clostridium perfringens, B. cereus), which tend to have shorter incubation periods.
NoV outbreaks were strongly associated with eating salads, sandwiches, and produce: these items were implicated in 56% of the 76 NoV outbreaks in which a food item was identified, compared with 19% of 124 bacterial outbreaks and 28% of 408 outbreaks of unknown etiology (chi-square test: p < 0.05) (Table
Specimen Screening Data from 6 States, 2000
In the 6 states for which data on specimen testing were obtained, the percentage of outbreaks tested for NoV that were positive was 44%–100%, and the total percentage in all 6 states was 79% (Table 4). Even in these states, NoV testing was much less likely to be performed than was testing for bacteria. Of 220 outbreaks from which stool samples were collected, specimens from 85 (39%) were tested for NoV compared to 207 (94%) tested for bacteria. Specimens from 55 outbreaks (25%) tested negative for bacteria, but no further testing for viruses was performed. The overall percentage of all outbreaks with specimens that tested positive for NoV was 30%, but in 2 states that tested all specimens for NoV (Georgia and Minnesota), the average percentage was 43% (22/51) compared with 27% (45/169) in the 4 other states that did not test fully for NoV. Assuming that these 4 states had tested specimens from these outbreaks for NoV, 110 (50%) of the 220 outbreaks with specimens collected in all 6 states would have been confirmed as caused by NoV.
The introduction of RT-PCR in the 1990s increased the percentage of all outbreaks attributable to NoV in the Unites States from <1% in 1991 to 12% in 2000. Nonetheless, noroviruses remain grossly underestimated as a cause of gastroenteritis outbreaks. From 1998 through 2000, most NoV outbreaks (76%) were reported from 11 states; 36 states, generally those with no PCR capability, reported either few or no outbreaks. Using data from 6 states, we estimated that if all specimens were tested for viruses, half of all foodborne outbreaks in the United States could be attributable to NoV. Even in these 6 states, bacteria were more likely to be tested for than viruses; specimens from 25% of outbreaks were negative for bacteria but not further tested. We also show that NoV outbreaks affect almost 50% more persons than in bacterial outbreaks (median = 25 versus 15 persons affected). Although NoV outbreaks were generally of short duration, symptoms were sufficiently severe in 9.8% of patients to require medical care and in 1%, hospitalization.
In addition to a historic lack of diagnostic assays, a further reason for underrecognition of NoV is a lack of specimens and epidemiologic information gathered from outbreaks that exhibit clinical features characteristic of viral gastroenteritis. We expected states that do not test for NoV to report more outbreaks of unknown etiology, but this was not the case. In fact, states that reported no NoV outbreaks also reported the lowest percentage of outbreaks with an undetermined etiology (47%, Table 1). This bias in the etiologic distribution of reported outbreaks toward bacterial causes that can be easily determined is further suggested by the lower number of outbreak reports in states with <10 NoV outbreaks from 1998 though 2000 (0.8–0.9 outbreaks/100,000 persons) compared with those states that reported >10 NoV outbreaks (2.3 outbreaks/100,000 persons). Genuine differences in the incidence of NoV disease (e.g., rural/urban) or different patterns of reporting disease among communities in different states are also possible.
We found that >56% of foodborne NoV outbreaks were associated with eating salads, sandwiches, or fresh produce, which confirms that contamination of foods requiring handling but no subsequent heating is an important source of NoV infection (9,20–22). Despite their well-documented role in large multistate NoV outbreaks (23–25), oysters have not been frequently associated with NoV disease in the last 10 years in the United States. We excluded only 2 multistate NoV outbreaks from the analysis, 1 of which was linked to oysters. Restaurants or caterers were associated with 39% of NoV outbreaks, yet in >50% of NoV outbreaks, no foodhandler was implicated. This finding probably reflects a lack of positive evidence rather than the actual ruling out of a foodhandler’s involvement. Although asymptomatic infections may play a role in transmission (26,27), and foodhandlers are likely to underreport illness, some outbreaks with no foodhandler implicated may be due to contamination of fresh produce at the source, as has been previously documented for NoV (21,27) and other foodborne viruses transmitted by the feco-oral route (28).
Our projected number of NoV outbreaks in each state may be overestimated because outbreaks that were tested for NoV were likely to have been more characteristic of NoV disease than those not tested. However, we only applied the proportion of outbreaks positive for NoV (79%) to outbreaks of unknown etiology that had already tested negative for bacteria. Moreover, between them, the 2 states that tested all nonbacterial outbreaks for NoV found 43% of outbreaks attributable to NoV, consistent with our estimate from all 6 states. Biases in surveillance data complicate straightforward extrapolation of our estimate of outbreaks with specimens from 6 states, to the group of reported outbreaks with no specimens collected in the same 6 states and in other states. Certain clinical characteristics of outbreaks of unknown etiology were similar to those of NoV outbreaks (e.g., percentage of patients vomiting); other epidemiologic characteristics were similar to those for bacterial outbreaks (e.g., implicated food). Etiologic make-up of outbreaks with no specimens collected is also likely to differ between states. Since specimens remain less likely to be collected from outbreaks of acute gastroenteritis of short duration, we think our estimate can be reasonably extrapolated to all outbreaks of unknown etiology.
Only a few small studies have looked at the relative impact of NoV as a cause of foodborne illness (Table
Efforts are required to increase the capacity of states to investigate outbreaks, irrespective of suspected cause, and include improved specimen collection and more widespread testing for viruses. Evaluation of epidemiologic criteria is needed to assess how best these can be used to guide testing strategies when laboratory resources are limited. Better appreciation of the exact causes of the large number of outbreaks of undetermined etiology will help better target measures to prevent foodborne disease. Furthermore, to be able to identify novel and intentionally introduced pathogens, the ability of state health departments to quickly investigate outbreaks and discount common causes is critical. “Real-time” collection systems of epidemiologic and sequence data from different outbreaks, such as developed in Europe (34), can provide insights into the epidemiology of NoV (35) and will allow for rapid comparison of data to rapidly identify common risk factors (such as foods contaminated at source) and implement control measures. While these initiatives are developed, however, the high disease impact of outbreaks of NoV illness should prompt prioritization of development and implementation of prevention measures, such as foodhandler education, by food safety agendas.
Dr. Widdowson is a medical epidemiologist in the Respiratory and Enteric Virus Branch, National Center for Infectious Disease, CDC. His research interests include all aspects of the epidemiology and prevention of viral gastroenteritis.
Acknowledgments
We thank all the states that routinely submit data to the Electronic Foodborne Outbreak Reporting System. We are grateful to Robert Tauxe, Patti Griffin, Chris Braden, and persons at the Food and Drug Administration for comments on the manuscript, and to Claudia Chesley for editorial comments.
Funding of work was by intramural funds either from CDC or state public health departments.
References
- Mead PS, Slutsker L, Dietz V, Slutsker L, Dietz V, McCagi LF, Food-related illness and death in the United States. Emerg Infect Dis. 1999;5:607–25. DOIPubMedGoogle Scholar
- Bell BP, Goldoft M, Griffin PM, Davis MA, Gordon DC, Tarr PI, A multistate outbreak of Escherichia coli O157:H7-associated bloody diarrhea and hemolytic uremic syndrome from hamburgers. The Washington experience. JAMA. 1994;272:1349–53. DOIPubMedGoogle Scholar
- Michino H, Araki K, Minami S, Takaya S, Sakai N, Miyazaki M, Massive outbreak of Escherichia coli O157:H7 infection in schoolchildren in Sakai City, Japan, associated with consumption of white radish sprouts. Am J Epidemiol. 1999;150:787–96.PubMedGoogle Scholar
- Lin FY, Morris JG Jr, Trump D, Tilghman D, Wood PK, Jackman N, Investigation of an outbreak of Salmonella enteritidis gastroenteritis associated with consumption of eggs in a restaurant chain in Maryland. Am J Epidemiol. 1988;128:839–44.PubMedGoogle Scholar
- Olsen SJ, MacKinnon LC, Goulding JS, Bean NH, Slutsker L. Surveillance for foodborne-disease outbreaks—United States, 1993–1997. MMWR CDC Surveill Summ. 2000;49(No.SS-1):1–64.PubMedGoogle Scholar
- Hall JA, Goulding JS, Bean NH, Tauxe RV, Hedberg CW. Epidemiologic profiling: evaluating foodborne outbreaks for which no pathogen was isolated by routine laboratory testing: United States, 1982–9. Epidemiol Infect. 2001;127:381–7. DOIPubMedGoogle Scholar
- Bresee JS, Widdowson M-A, Monroe SS, Glass RI. Foodborne viral gastroenteritis: challenges and opportunities. Clin Infect Dis. 2002;35:748–53. DOIPubMedGoogle Scholar
- Deneen VC, Hunt JM, Paule CR, James OI, Johnson RG, Raymond MJ, The impact of foodborne calicivirus disease: the Minnesota experience. J Infect Dis. 2000;181(Suppl 2):S281–3. DOIPubMedGoogle Scholar
- Hedberg CW, Osterholm MT. Outbreaks of food-borne and waterborne viral gastroenteritis. Clin Microbiol Rev. 1993;6:199–210.PubMedGoogle Scholar
- Kaplan JE, Feldman R, Campbell DS, Lookabaugh C, Gary GW. The frequency of a Norwalk-like pattern of illness in outbreaks of acute gastroenteritis. Am J Public Health. 1982;72:1329–32. DOIPubMedGoogle Scholar
- Greenberg HB, Valdesuso J, Yolken RH, Gangarosa E, Gary W, Wyatt RG, Role of Norwalk virus in outbreaks of nonbacterial gastroenteritis. J Infect Dis. 1979;139:564–8. DOIPubMedGoogle Scholar
- Monroe SS, Glass RI, Noah N, Flewett TH, Caul EO, Ashton CI, Electron microscopic reporting of gastrointestinal viruses in the United Kingdom, 1985–87. J Med Virol. 1991;33:193–8. DOIPubMedGoogle Scholar
- Gary GW Jr, Kaplan JE, Stine SE, Anderson LJ. Detection of Norwalk virus antibodies and antigen with a biotin-avidin immunoassay. J Clin Microbiol. 1985;22:274–8.PubMedGoogle Scholar
- Kaplan JE, Gary GW, Baron RC, Singh N, Schonberger LB, Feldman R, Epidemiology of Norwalk gastroenteritis and the role of Norwalk virus in outbreaks of acute nonbacterial gastroenteritis. Ann Intern Med. 1982;96:756–61.PubMedGoogle Scholar
- Jones TF, Gerber DE. Perceived etiology of foodborne illness among public health personnel. Emerg Infect Dis. 2001;7:904–5. DOIPubMedGoogle Scholar
- Jiang X, Wang J, Graham DY, Estes MK. Detection of Norwalk virus in stool by polymerase chain reaction. J Clin Microbiol. 1992;30:2529–34.PubMedGoogle Scholar
- Moe CL, Gentsch J, Ando T, Grohmann G, Monroe SS, Jiang X, Application of PCR to detect Norwalk virus in fecal specimens from outbreaks of gastroenteritis. J Clin Microbiol. 1994;32:642–8.PubMedGoogle Scholar
- Fankhauser RL, Monroe SS, Noel JS, Ando TA, Glass RI. Epidemiologic and molecular trends of Norwalk-like viruses associated with outbreaks of gastroenteritis in the United States. J Infect Dis. 2002;186:1–7. DOIPubMedGoogle Scholar
- Centers for Disease Control and Prevention. Guide to confirming the diagnosis in foodborne diseases. [cited 2004 Feb 1].Available from http://www.cdc.gov/foodborneoutbreaks/guide_fd.htm
- Daniels NA, Bergmire-Sweat DA, Schwab KJ, Hendricks KA, Reddy S, Rowe SM, A foodborne outbreak of gastroenteritis associated with Norwalk-like viruses: first molecular traceback to deli sandwiches contaminated during preparation. J Infect Dis. 2000;181:1467–70. DOIPubMedGoogle Scholar
- Ponka A, Maunula L, von Bonsdorff CH, Lyytikainene O. Outbreak of calicivirus gastroenteritis associated with eating frozen raspberries. Eurosurveillance. 1999;4:66–9.PubMedGoogle Scholar
- Kuritsky JN, Osterholm MT, Greenberg HB, Korlath JA, Godes JR, Hedberg CW, Norwalk gastroenteritis: a community outbreak associated with bakery product consumption. Ann Intern Med. 1984;100:519–21.PubMedGoogle Scholar
- Dowell SF, Groves C, Kirkland KB, Cicirello HG, Ando T, Jin Q, A multistate outbreak of oyster-associated gastroenteritis: implications for interstate tracing of contaminated shellfish. J Infect Dis. 1995;171:1497–503. DOIPubMedGoogle Scholar
- Kohn MA, Farley TA, Ando T, Curtis M, Wilson SA, Jin Q, An outbreak of Norwalk virus gastroenteritis associated with eating raw oysters: implications for maintaining safe oyster beds. JAMA. 1995;273:466–71. DOIPubMedGoogle Scholar
- Berg DE, Kohn MA, Farley TA, McFarland LM. Multi-state outbreaks of acute gastroenteritis traced to fecal-contaminated oysters harvested in Louisiana. J Infect Dis. 2000;181(Suppl 2):S381–6. DOIPubMedGoogle Scholar
- Parashar UD, Dow L, Fankhauser RL, Humphrey CD, Miller J, Ando T, An outbreak of viral gastroenteritis associated with consumption of sandwiches: implications for the control of transmission by food handlers. Epidemiol Infect. 1998;121:615–21. DOIPubMedGoogle Scholar
- Gaulin CD, Ramsay D, Cardinal P, D’Halevyn M-A. Epidemie de gastro-enterite d'origine virale associee a la consommation de framboises importees. Can J Public Health. 1999;90:37–40.PubMedGoogle Scholar
- Dentinger CM, Bower WA, Nainan OV, Cotter SM, Myers G, Dubusky LM, An outbreak of hepatitis A associated with green onions. J Infect Dis. 2001;183:1273–6. DOIPubMedGoogle Scholar
- Hedlund KO. Rubilar-Abreu, Svensson L. Epidemiology of calicivirus infections in Sweden, 1994–1998. J Infect Dis. 2000;181(Suppl 2):S275–80. DOIPubMedGoogle Scholar
- Lindqvist R, Andersson Y, Lindback J, Wegscheider M, Eriksson Y, Tidestrom L, A one-year study of foodborne illnesses in the municipality of Uppsala, Sweden. Emerg Infect Dis. 2001;7:588–92. DOIPubMedGoogle Scholar
- Evans HS, Madden P, Douglas C, Adak GK, O’Brien SJ, Djuretic T, General outbreaks of infectious intestinal disease in England and Wales: 1995 and 1996. Commun Dis Public Health. 1998;1:165–71.PubMedGoogle Scholar
- Lopman BA, Adak GK, Reacher MH, Brown DW. Two epidemiologic patterns of norovirus outbreaks: surveillance in England and Wales, 1992–2000. Emerg Infect Dis. 2003;9:71–7.PubMedGoogle Scholar
- Green KY, Chanock RM, Kapikian AZ. Human caliciviruses. In: Knipe DM, Howley PM, editors. Fields virology. Vol 1. 4th ed. Philadelphia: Lippincott Williams & Wilkins; 2001. p. 841–74.
- Koopmans M, Vennema H, Heersma H, van Strien E, van Duynhoven Y, Brown D, Early identification of common-source foodborne virus outbreaks in Europe. Emerg Infect Dis. 2003;9:1136–42.PubMedGoogle Scholar
- Widdowson MA, Cramer EH, Hadley L, Bresee JS, Beard RS, Bulens SN, Outbreaks of acute gastroenteritis on cruise ships and on land: identification of a predominant circulating strain of norovirus—United States, 2002. J Infect Dis. 2004;190:27–36. DOIPubMedGoogle Scholar
Figures
Tables
Cite This Article1Efforts in 1998 to improve outbreak reporting resulted in more outbreaks being retrospectively attributed to this period. The current figures for 1993 to 1997 are 65 (2%) of 3,257 outbreaks attributable to NoV and 67% of unknown etiology.
Table of Contents – Volume 11, Number 1—January 2005
| EID Search Options |
|---|
|
|
|
|
|
|
Please use the form below to submit correspondence to the authors or contact them at the following address:
Marc-Alain Widdowson, Respiratory and Enteric Virus Branch, Centers for Disease Control and Prevention, Mailstop G04, 1600 Clifton Rd NE, Atlanta, GA 30333, USA; fax: 1-404-639-3645
Top