Volume 11, Number 12—December 2005
Research
Viral Load Distribution in SARS Outbreak
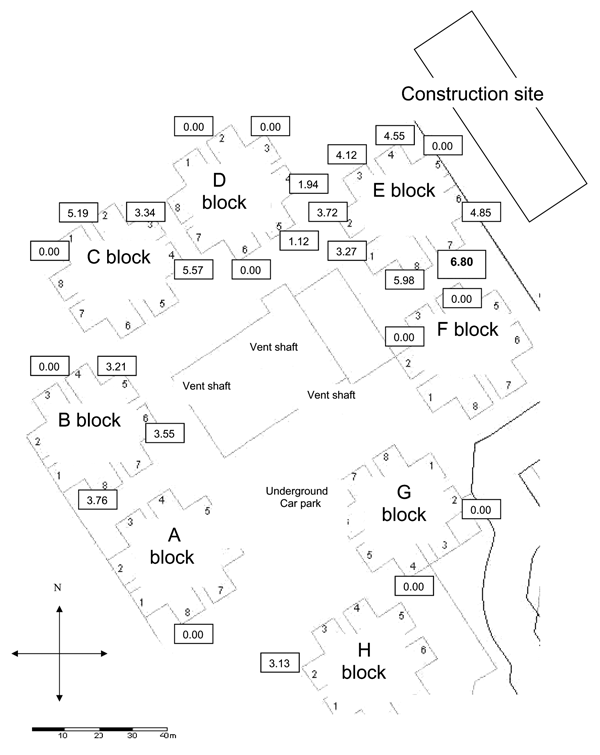
Figure 2

Figure 2. Scaled map of Amoy Gardens units and distribution of the median viral load (log10 copies/mL) of the nasopharyngeal specimens (values in boxes) of patients in their respective residential blocks (index patient lived in E7).
Page created: February 02, 2012
Page updated: February 02, 2012
Page reviewed: February 02, 2012
The conclusions, findings, and opinions expressed by authors contributing to this journal do not necessarily reflect the official position of the U.S. Department of Health and Human Services, the Public Health Service, the Centers for Disease Control and Prevention, or the authors' affiliated institutions. Use of trade names is for identification only and does not imply endorsement by any of the groups named above.