Skip directly to site content Skip directly to page options Skip directly to A-Z link Skip directly to A-Z link Skip directly to A-Z link
Volume 11, Number 12—December 2005
Perspective

Community Epidemiology Framework for Classifying Disease Threats

Andy Fenton*Comments to Author  and Amy B. Pedersen†
Author affiliations: *Institute of Zoology, London, United Kingdom; †University of Virginia, Charlottesville, Virginia, USA

Main Article

Figure 3

Stochastic model predictions of system behavior in β12–β22 parameter space. Each square represents the average of 100 simulation runs. Two measures of pathogen persistence are shown: A) Mean prevalence of infection in H2, where black represents zero prevalence and white represents 100% prevalence, and B) Proportion of time in which the pathogen is absent (i.e., has faded out) from H2, where white represents zero fade-outs (i.e., the pathogen is always present in H2) and black represents 100% fad

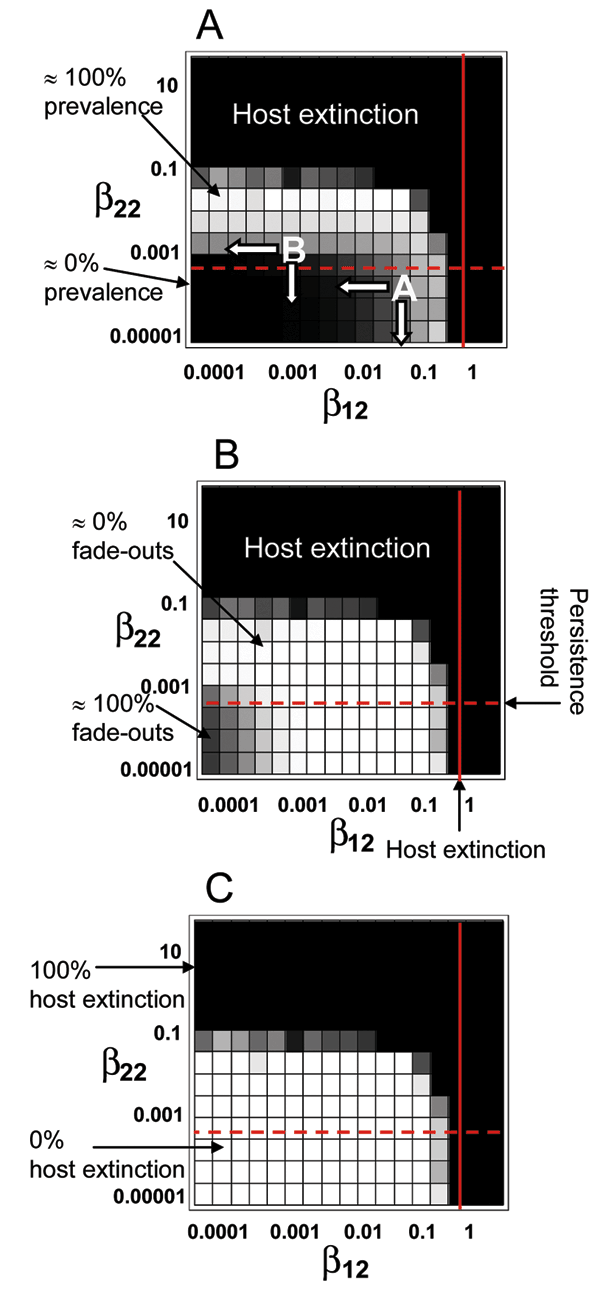
Figure 3. Stochastic model predictions of system behavior in β12–β22 parameter space. Each square represents the average of 100 simulation runs. Two measures of pathogen persistence are shown: A) Mean prevalence of infection in H2, where black represents zero prevalence and white represents 100% prevalence, and B) Proportion of time in which the pathogen is absent (i.e., has faded out) from H2, where white represents zero fade-outs (i.e., the pathogen is always present in H2) and black represents 100% fade-outs (i.e., the pathogen never infects H2). C) Probability of pathogen-driven host extinction, where black represents the case in which all runs resulted in host extinction and white the case in which none of the runs resulted in host extinction. The horizontal dashed lines are the deterministic approximations of the persistence threshold (given by R0 = 1 when β12 = 0) and the vertical lines are the deterministic approximations of the host extinction threshold. The points marked A and B in panel A and the associated arrows represent different control scenarios for 2-host pathogen systems located at different points within the continuum (see text for details).

Main Article

Page created: February 02, 2012
Page updated: February 02, 2012
Page reviewed: February 02, 2012
The conclusions, findings, and opinions expressed by authors contributing to this journal do not necessarily reflect the official position of the U.S. Department of Health and Human Services, the Public Health Service, the Centers for Disease Control and Prevention, or the authors' affiliated institutions. Use of trade names is for identification only and does not imply endorsement by any of the groups named above.
file_external