Volume 12, Number 4—April 2006
Research
Economic Impact of Lyme Disease
Figure 3
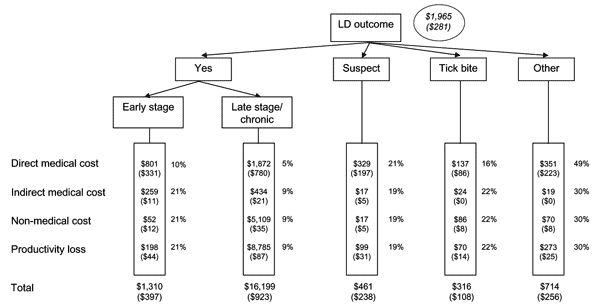
Figure 3. Expected mean (median) cost per Lyme disease (LD) patient in Maryland Eastern Shore by using LD outcome tree. Direct medical costs collected from medical record abstraction (1997–2000). Indirect medical costs, nonmedical costs, and productivity losses were acquired from patient questionnaire (1998–1999). The mean (median) of all costs was aggregated across all diagnostic groups of patients. Percentages refer to probabilities of outcome of a possible LD case (clinically defined early-stage LD, clinically defined late-stage LD, suspected LD, tick bite, and other related complaints). Total percentages do not add to 100% because of rounding. All costs were converted to 2000 equivalent.
1Current affiliation: Maryland Department of Health and Mental Hygiene, Baltimore, Maryland, USA