Volume 12, Number 7—July 2006
Dispatch
Detection of Infectious Poxvirus Particles
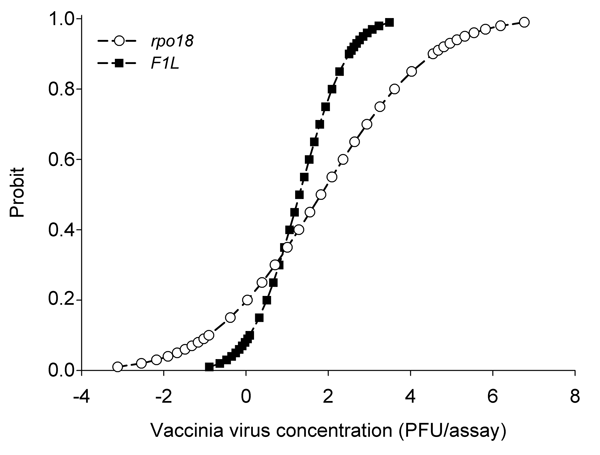
Figure 2

Figure 2. Comparison of probit (predicted proportion of replicates positive) regression curves for rpo18 (circles) and F1L (squares) genes calculated with SPSS software (SPSS Inc., Chicago, IL, USA). Probit versus vaccinia virus concentration was obtained from 12 replicates of 7 dilutions from 1,500 PFU to 0.1 PFU.
Page created: December 19, 2011
Page updated: December 19, 2011
Page reviewed: December 19, 2011
The conclusions, findings, and opinions expressed by authors contributing to this journal do not necessarily reflect the official position of the U.S. Department of Health and Human Services, the Public Health Service, the Centers for Disease Control and Prevention, or the authors' affiliated institutions. Use of trade names is for identification only and does not imply endorsement by any of the groups named above.