Volume 13, Number 3—March 2007
Research
Diversity and Distribution of Borrelia hermsii
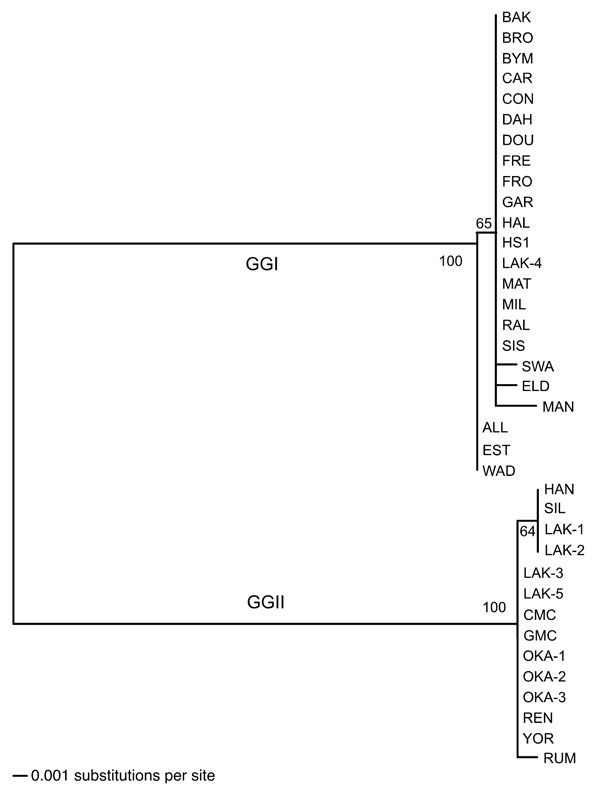
Figure 2

Figure 2. Phylogram of the intergenic spacer sequences of 37 Borrelia hermsii isolates. The tree was constructed with ClustalV and the neighbor-joining method with 1,000 bootstrap replicates. Numbers at the nodes are the percentages of bootstraps that supported this pattern. The scale bar for the branch lengths represents the number of substitutions per site. An unrooted tree is shown because a gap in the alignment with B. turicatae resulted in the removal of a polymorphic site in some GGII isolates of B. hermsii.
Page created: June 29, 2010
Page updated: June 29, 2010
Page reviewed: June 29, 2010
The conclusions, findings, and opinions expressed by authors contributing to this journal do not necessarily reflect the official position of the U.S. Department of Health and Human Services, the Public Health Service, the Centers for Disease Control and Prevention, or the authors' affiliated institutions. Use of trade names is for identification only and does not imply endorsement by any of the groups named above.