Volume 13, Number 3—March 2007
Research
Matrix Protein 2 Vaccination and Protection against Influenza Viruses, Including Subtype H5N1
Figure 6

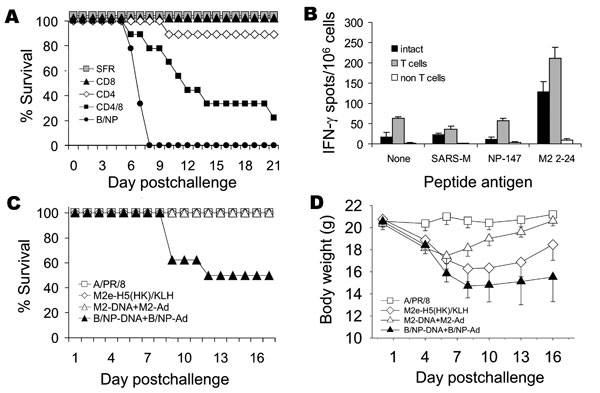
Figure 6. Role of T- and B-cell immunity in matrix protein 2 (M2)–specific protective immunity. A) Mice (9 per group) were immunized with M2-DNA or B/NP-DNA and boosted with matched adenovirus (Ad) as described in Methods. Three weeks after Ad boost, M2-DNA groups were acutely depleted of T cells with monoclonal antibodies (MAbs) to CD4+ or CD8+ or both, or given control MAb SFR3-DR5, as described in Methods. Mice were challenged with 1.5× 10⁴ 50% lethal doses (LD50) of A/PR/8. Compared with the cumulative survival rate for the SFR control, survival rates differed significantly for mice depleted of both T-cell subsets (p<0.001, log-rank), although some protection remained, which differed significantly from that of the B/NP control (p<0.001, log-rank). B) Mice were immunized with M2-DNA+M2-Ad as described under A. Five months after mice received the Ad boost, spleen cells were isolated and pooled from immune mice (n = 10), fractionated into T-cell and non–T-cell populations, and assayed for interferon-γ (IFN-γ)–producing cells by enzyme-linked immunosorbent spot assay, as described in Methods. C and D) Serum collected from immune mice was passively transferred intraperitoneally into naive BALB/c mice (8 per group). The recipients were challenged with 10 LD50 of A/PR/8 and monitored for survival (C) and weight loss (D). The cumulative survival rate for mice given A/PR/8 immune serum, M2-DNA+M2-Ad-immune serum, or M2e-H5(HK)/keyhole limpet hemocyanin–immune serum was significantly higher than that for mice given B/NP-DNA+B/NP-Ad–immune serum (p<0.001, log rank). For weight loss, M2 prime-boost differed from B/NP prime-boost at days 8, 10, and 13 (p≤0.003, analysis of variance; p<0.05, Holm-Sidak pairwise multiple comparison).