Volume 13, Number 5—May 2007
Research
Plague and the Human Flea, Tanzania
Anne Laudisoit*† , Herwig Leirs*‡, Rhodes H. Makundi§, Stefan Van Dongen*, Stephen Davis*, Simon Neerinckx*¶, Jozef Deckers¶, and Roland Libois†
Figure 2
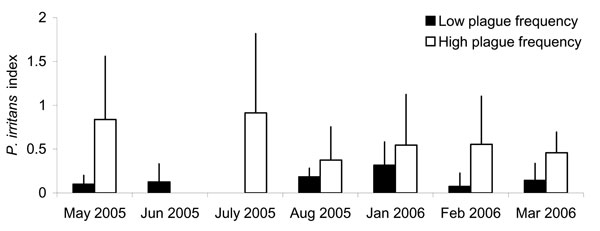
Figure 2. Monthly domestic Pulex irritans index, averaged for low plague frequency villages (black columns) and high plague frequency villages (white columns). The error bars indicate standard deviation from the mean. No data were available for high plague frequency villages in June 2005 or for low plague frequency villages in July 2005.
Page created: June 23, 2010
Page updated: June 23, 2010
Page reviewed: June 23, 2010
The conclusions, findings, and opinions expressed by authors contributing to this journal do not necessarily reflect the official position of the U.S. Department of Health and Human Services, the Public Health Service, the Centers for Disease Control and Prevention, or the authors' affiliated institutions. Use of trade names is for identification only and does not imply endorsement by any of the groups named above.