Volume 13, Number 9—September 2007
Research
Frequent Travelers and Rate of Spread of Epidemics
T. Déirdre Hollingsworth* , Neil M. Ferguson*, and Roy M. Anderson*
Appendix Figure 2
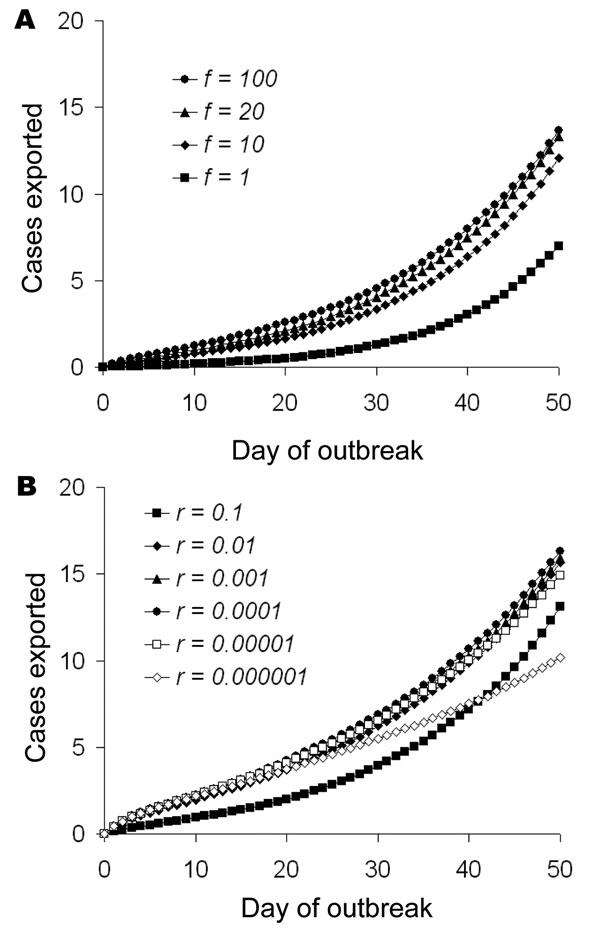
Appendix Figure 2. Mean number of exported cases from 50,000 simulations. Parameters are as in Figure 2, with assortative mixing (φ = 0.25) and initiating the epidemic among high-frequency fliers. A ) Effect of varying relative frequency of flying in high-frequency travelers with that in low-frequency fliers (f = 1, 10, 20, and 100. B) Effect of varying proportion of the population in the high-frequency traveling group (r = 0.000001, 0.00001, 0.0001, 0.001, 0.01, and 0.1.
Page created: July 01, 2010
Page updated: July 01, 2010
Page reviewed: July 01, 2010
The conclusions, findings, and opinions expressed by authors contributing to this journal do not necessarily reflect the official position of the U.S. Department of Health and Human Services, the Public Health Service, the Centers for Disease Control and Prevention, or the authors' affiliated institutions. Use of trade names is for identification only and does not imply endorsement by any of the groups named above.