Volume 14, Number 10—October 2008
Research
Ecologic Factors Associated with West Nile Virus Transmission, Northeastern United States
Heidi E. Brown1, James E. Childs, Maria A. Diuk-Wasser, and Durland Fish
Figure 2
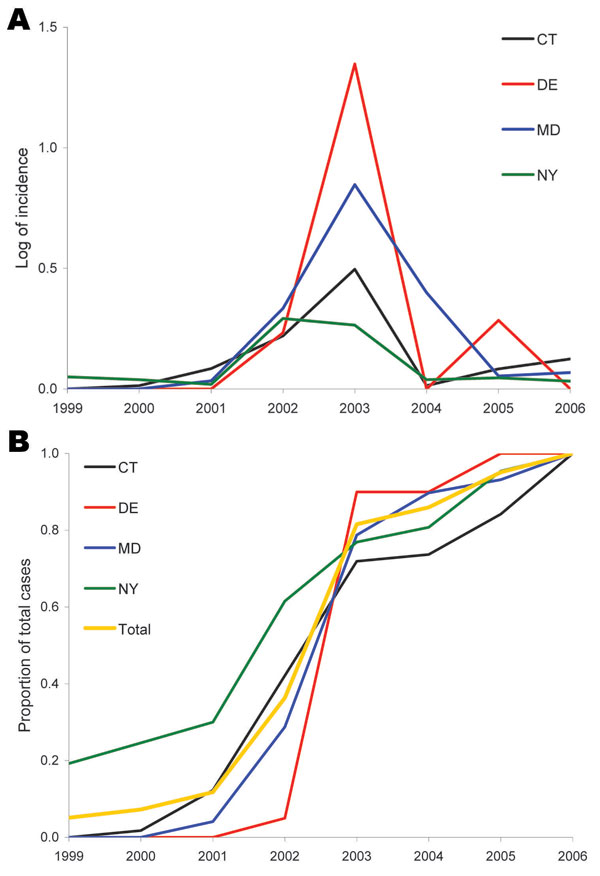
Figure 2. A) Epidemic curve of mean incidence (log+1 transformed) of West Nile virus disease in humans, by state, 1999–2006. The 4 states depicted are representative of the variation among the 8 states in the study area. CT, Connecticut; DE, Delaware; MD, Maryland; NY, New York. This graph shows the trend toward increasing incidence and a regional peak in 2003. NY seems to show a 2-year plateau with similar values for 2002 and 2003. B) Cumulative proportion of total cases for the 8 years also highlighting the 2003 regional peak but suggesting a spatial spread where cases started to rise earlier in NY than in states such as DE that were more distant from the epicenter.
Page created: July 13, 2010
Page updated: July 13, 2010
Page reviewed: July 13, 2010
The conclusions, findings, and opinions expressed by authors contributing to this journal do not necessarily reflect the official position of the U.S. Department of Health and Human Services, the Public Health Service, the Centers for Disease Control and Prevention, or the authors' affiliated institutions. Use of trade names is for identification only and does not imply endorsement by any of the groups named above.