Volume 14, Number 8—August 2008
Dispatch
Cutaneous Infrared Thermometry for Detecting Febrile Patients
Figure 2
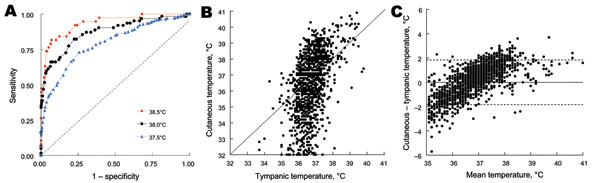
Figure 2. A) Comparison of receiver operating characteristic (ROC) curves showing relationship between sensitivity (true positive) and 1 – specificity (true negative) in determining value of cutaneous temperature for predicting various thresholds of hyperthermia definitions (37.5°C, 38.0°C, and 38.5°C) of tympanic temperature. Areas under ROC curves (95% confidence interval) were 0.935 (0.876–0.966), 0.873 (0.807–0.917), and 0.792 (0.749–0.829), respectively, and all were significantly (p<0.001) different from the identity line (dashed diagonal line). B) Correlation and C) Bland and Altman diagrams comparing cutaneous and tympanic temperature measurements (n = 2,026 patients). Values on the y-axis in panel C represent differences between cutaneous and tympanic temperatures. The solid horizontal line in panel C represents the null difference between cutaneous and tympanic temperatures, and the 2 dashed horizontal lines represent ± 2 standard deviations.