Volume 15, Number 11—November 2009
Dispatch
Evidence-based Tool for Triggering School Closures during Influenza Outbreaks, Japan
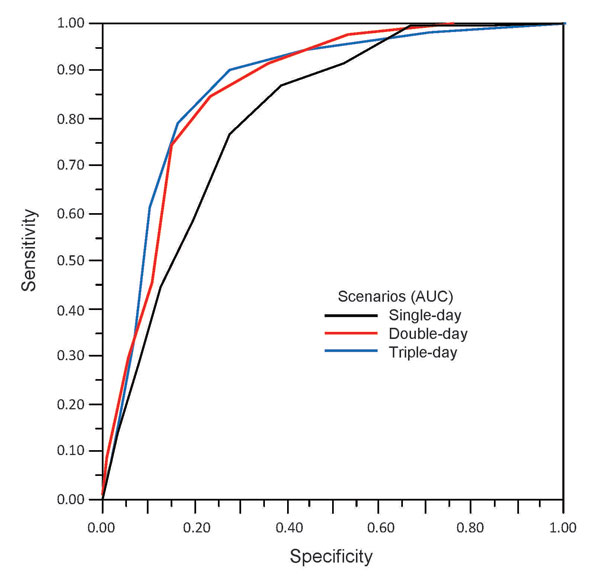
Figure 2

Figure 2. The receiver operating characteristic (ROC) curve for detection of influenza outbreak by 1%–9% thresholds under single-day, double-day, triple-day scenarios. ROC space is defined on the x axis as 1 – specificity and on the y axis as sensitivity. The area under the curve (AUC) is an indicator of the quality of a model; larger AUC values corresponded to better performance. Optimal thresholds for the 3 scenarios are *single-day, 5%; †double-day, 4%; and ‡triple-day, 3%.
Page created: December 09, 2010
Page updated: December 09, 2010
Page reviewed: December 09, 2010
The conclusions, findings, and opinions expressed by authors contributing to this journal do not necessarily reflect the official position of the U.S. Department of Health and Human Services, the Public Health Service, the Centers for Disease Control and Prevention, or the authors' affiliated institutions. Use of trade names is for identification only and does not imply endorsement by any of the groups named above.