Volume 15, Number 2—February 2009
Letter
Clostridium difficile–associated Disease in the Elderly, United States
Jyotsna Jagai and Elena Naumova
Appendix Figure
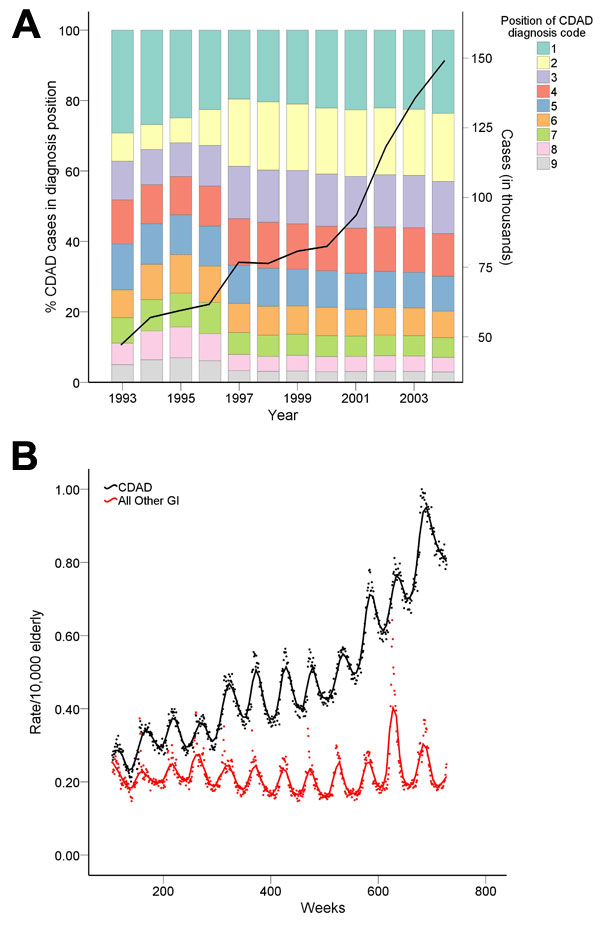
Appendix Figure. Trends in hospitalization cases for Clostridium difficile-associated disease (CDAD) in the elderly (>65 years of age) in the United States over a 12-year period (1993-2004). A) Changes in position of CDAD diagnosis code in hospitalization records over the period. The black line in panel A shows increasing number of hospitalizations (in thousands of cases) for CDAD over the same period. B) Weekly rate (per 10,000 elderly) of hospitalizations for CDAD (black dots) compared with hospitalizations for all other gastrointestinal (GI) infections (red dots). Solid lines represent smoothed seasonal patterns.
Page created: December 08, 2010
Page updated: December 08, 2010
Page reviewed: December 08, 2010
The conclusions, findings, and opinions expressed by authors contributing to this journal do not necessarily reflect the official position of the U.S. Department of Health and Human Services, the Public Health Service, the Centers for Disease Control and Prevention, or the authors' affiliated institutions. Use of trade names is for identification only and does not imply endorsement by any of the groups named above.