Volume 16, Number 2—February 2010
Dispatch
Increasing Incidence of Nontuberculous Mycobacteria, Taiwan, 2000–2008
Chih-Cheng Lai, Che-Kim Tan, Chien-Hong Chou, Hsiao-Leng Hsu, Chun-Hsing Liao, Yu-Tsung Huang, Chuan-Liang Kao, Kwen-Tay Luh, and Po-Ren Hsueh
Figure
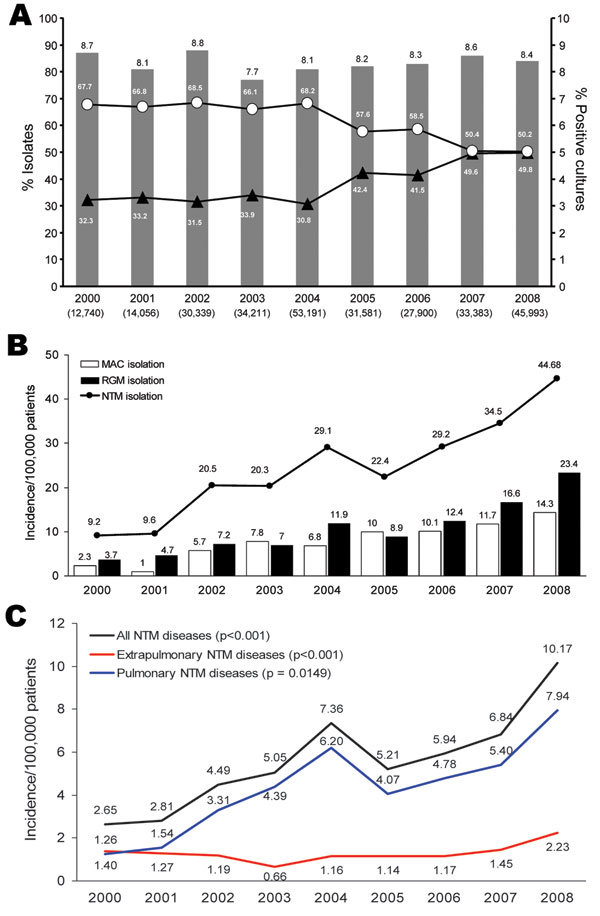
Figure. Incidence data for clinical samples submitted for mycobacterial culture, National Taiwan University Hospital, Taipei, Taiwan, January 2000–December 2008. A) Annual number and rate of isolates of nontuberculous mycobacteria (NTM) (triangles) and Mycobacterium tuberculosis (circles). B) Annual incidence of isolates of NTM, M. avium complex (MAC), and rapidly growing mycobacteria (RGM). C) Annual incidence of NTM disease, pulmonary disease, and extrapulmonary disease.
Page created: December 10, 2010
Page updated: December 10, 2010
Page reviewed: December 10, 2010
The conclusions, findings, and opinions expressed by authors contributing to this journal do not necessarily reflect the official position of the U.S. Department of Health and Human Services, the Public Health Service, the Centers for Disease Control and Prevention, or the authors' affiliated institutions. Use of trade names is for identification only and does not imply endorsement by any of the groups named above.