Recurrent Granulibacter bethesdensis Infections and Chronic Granulomatous Disease
David E. Greenberg

, Adam R. Shoffner, Adrian M. Zelazny, Michael E. Fenster, Kol A. Zarember, Frida Stock, Li Ding, Kimberly R. Marshall-Batty, Richard L. Wasserman, David F. Welch, Kishore Kanakabandi, Dan E. Sturdevant, Kimmo Virtaneva, Stephen F. Porcella, Patrick R. Murray, Harry L. Malech, and Steven M. Holland
Author affiliations: Author affiliations: National Institutes of Health, Bethesda, Maryland, USA (D.E. Greenberg, A.R. Shoffner, A.M. Zelazny, M.E. Fenster, K.A. Zarember, F. Stock, L. Ding, K.R. Marshall-Batty, P.R. Murray, H.L. Malech, S.M. Holland); University of Texas Southwestern Medical Center, Dallas, Texas, USA (R.L. Wasserman, D.F. Welch); Children's Medical Center, Dallas (D.F. Welch); Medical City Dallas Hospital, Dallas (D.F. Welch); National Institutes of Health, Hamilton, Montana, USA (K. Kanakabandi, D.E. Sturdevant, K. Virtaneva, S.F. Porcella)
Main Article
Figure 4

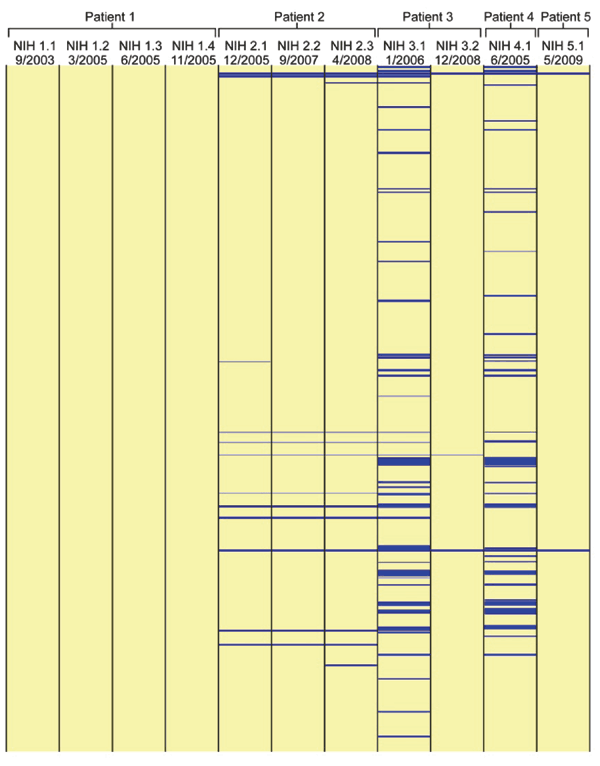
Figure 4. Physical gene representation of DNA hybridization of 11 isolates of Granulibacter bethesdensis by DNA–DNA hybridization microarray-based investigation of gene distributions among G. bethesdensis isolates. Every open reading frame in the G. bethesdensis type strain is represented. Hybridization is shown in yellow, and absence of hybridization is shown in blue. Four sequential isolates (NIH 1.1, NIH 1.2, NIH 1.3, and NIH 1.4) from patient 1 are shown from left to right and group with an identical hybridization pattern. Three sequential isolates (NIH 2.1, NIH 2.2, and NIH 2.3) from patient 2 are shown from left to right and demonstrate virtually identical patterns of hybridization. Two isolates (NIH 3.1 and NIH 3.2) from patient 3 have different hybridization patterns. One isolate (NIH 4.1) from patient 4 has a unique hybridization pattern. One isolate (NIH 5.1) from patient 5 is distinct from that of his brother (patient 2). Dates that each infected tissue sample were obtained are listed. NIH, National Institutes of Health.
Main Article
Page created: August 28, 2011
Page updated: August 28, 2011
Page reviewed: August 28, 2011
The conclusions, findings, and opinions expressed by authors contributing to this journal do not necessarily reflect the official position of the U.S. Department of Health and Human Services, the Public Health Service, the Centers for Disease Control and Prevention, or the authors' affiliated institutions. Use of trade names is for identification only and does not imply endorsement by any of the groups named above.
