Volume 17, Number 11—November 2011
Research
Dynamics of Cholera Outbreaks in Great Lakes Region of Africa, 1978–2008
Didier Bompangue Nkoko, Patrick Giraudoux, Pierre-Denis Plisnier, Annie Mutombo Tinda, Martine Piarroux, Bertrand Sudre, Stephanie Horion, Jean-Jacques Muyembe Tamfum, Benoît Kebela Ilunga, and Renaud Piarroux
Figure 1
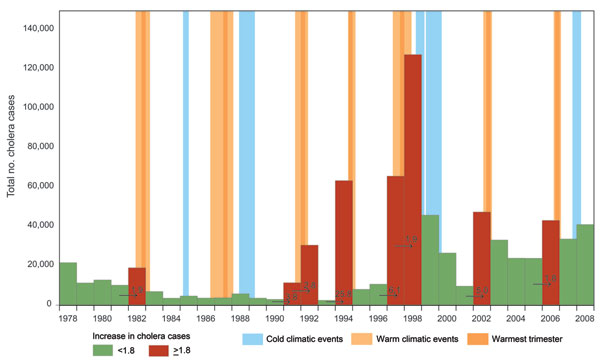
Figure 1. Yearly number of cholera cases in the African Great Lakes region (Burundi, Democratic Republic of Congo, Kenya, Rwanda, Tanzania, and Uganda), 1978–2008. Red bars indicate years with large increases in cholera cases. Numbers on arrows represent the increase factor in cholera cases. Warm climatic events (indicated by light orange background) had a duration of >5 months and a sea surface temperature increase of >0.5°C simultaneously in Niño 3 (eastern Pacific, from 90°W–150°W and 5°S–5°N) and Niño 4 (western Pacific, from 160°E–150°W and 5°S–5°N) regions.
Page created: October 19, 2011
Page updated: October 19, 2011
Page reviewed: October 19, 2011
The conclusions, findings, and opinions expressed by authors contributing to this journal do not necessarily reflect the official position of the U.S. Department of Health and Human Services, the Public Health Service, the Centers for Disease Control and Prevention, or the authors' affiliated institutions. Use of trade names is for identification only and does not imply endorsement by any of the groups named above.