Volume 17, Number 11—November 2011
Research
Dynamics of Cholera Outbreaks in Great Lakes Region of Africa, 1978–2008
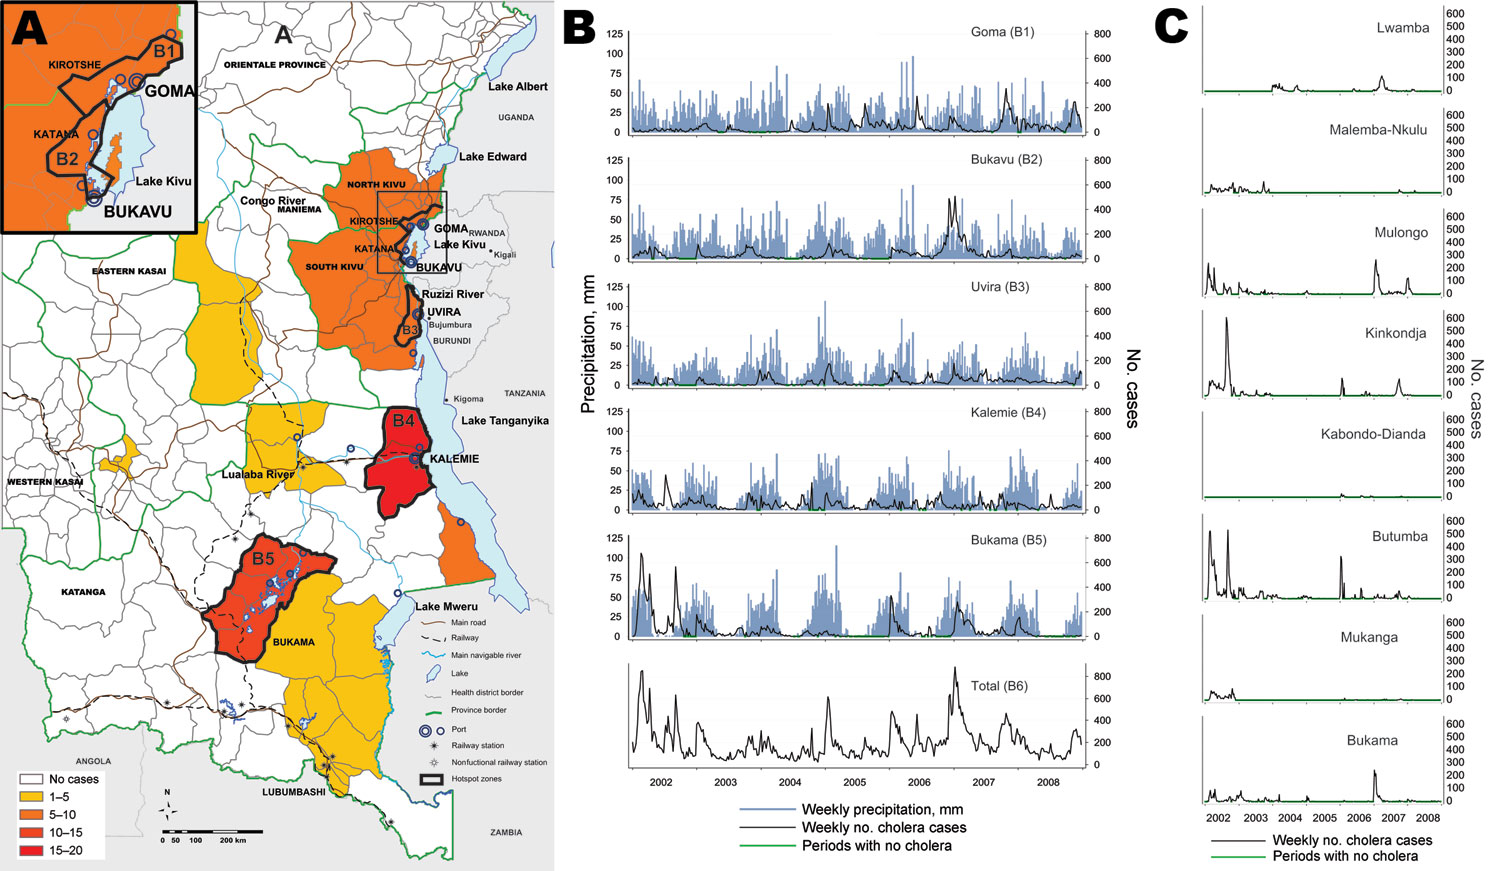
Figure 3

Figure 3. Temporal-spatial evolution of cholera cases in 5 hotspots in the African Great Lakes region, 2002–2008. A) Spatial distribution of cholera in the provinces of Katanga, North Kivu, and South Kivu (Democratic Republic of Congo). Health districts are colored according to the risk ratio of the cluster, as calculated by using SatSCan software (Kulldorf, Cambridge, UK). B) Evolution of the weekly number of cholera cases in the 5 hotspots (B1–B5). B1) Goma and Kirotshe health districts; B2) Bukavu and Katana health districts; B3) Uvira health district; B4) Kalemie and Nyemba health districts; B5) 8 health districts in the Upper Congo River Basin (see district names in panel C); B6) total cases for the 5 hotspots. Green indicates periods without cholera; blue indicates estimated weekly rainfalls. The global curve did not show any remission periods. C) Evolution of the weekly number of cholera cases in the 8 health districts composing the Upper Congo Basin hotspot. The epidemic curve in B5 was composed of partially synchronous epidemics separated by periods of lull.