Volume 17, Number 11—November 2011
Research
Dynamics of Cholera Outbreaks in Great Lakes Region of Africa, 1978–2008
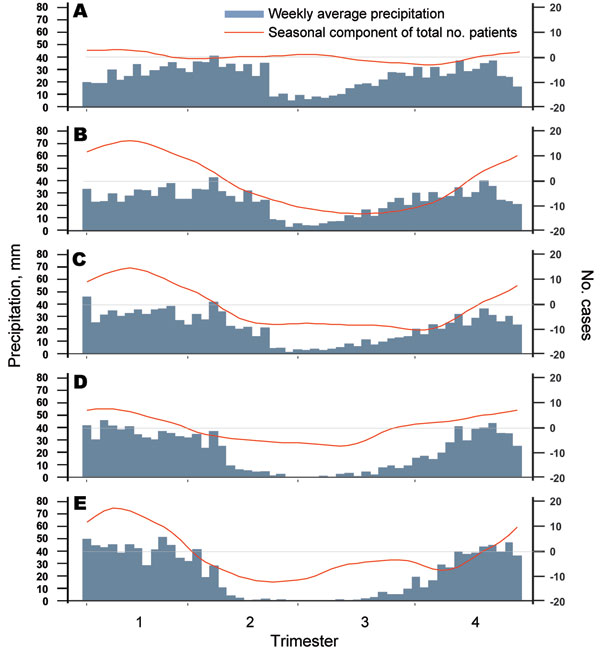
Figure 4

Figure 4. Seasonal patterns/components of cholera outbreaks for 5 hotspots in the African Great Lakes region, 2002–2008. Hotspots are Goma (A), Bukavu (B), Uvira (C), Kalemie (D), and Upper Congo Basin (E). Blue indicates the weekly average precipitation (in mm); red indicates the seasonal component of the total number of patients after the time series was decomposed into a trend and seasonal and residual components by using a seasonal-trend decomposition procedure based on loess regression. Horizontal gray lines indicate seasonal component = 0.
Page created: October 19, 2011
Page updated: October 19, 2011
Page reviewed: October 19, 2011
The conclusions, findings, and opinions expressed by authors contributing to this journal do not necessarily reflect the official position of the U.S. Department of Health and Human Services, the Public Health Service, the Centers for Disease Control and Prevention, or the authors' affiliated institutions. Use of trade names is for identification only and does not imply endorsement by any of the groups named above.