Volume 17, Number 2—February 2011
Dispatch
Pandemic (H1N1) 2009–associated Pneumonia in Children, Japan
Maki Hasegawa, Takafumi Okada, Hiroshi Sakata, Eiichi Nakayama, Tatsuo Fuchigami, Yasuji Inamo, Hideo Mugishima, Takeshi Tajima, Satoshi Iwata, Miyuki Morozumi, Kimiko Ubukata, Haruo Watanabe, and Takashi Takahashi
Figure 2
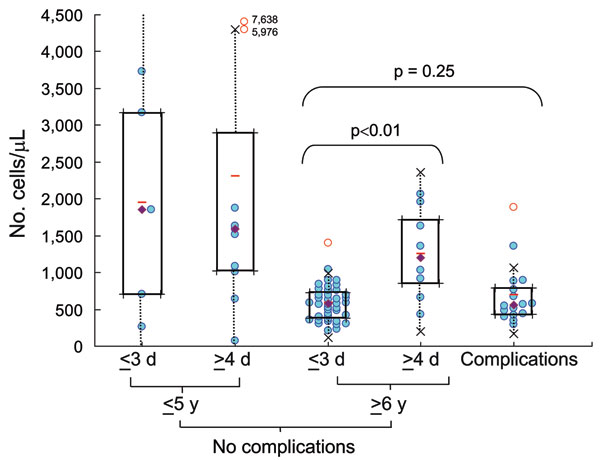
Figure 2. Lymphocyte counts (cells/μL) in blood samples from 5 groups (patients with complications, patients >6 years of age without complications who had early or late hospital admission, and patients <5 years of age without complications who had early or late hospitalization). Data were analyzed by using box-and-whisker plots. Lower limit, median, and upper limit shown within each box correspond to the 25%, 50%, and 75% percentile, respectively; half of the patients considered fall within each box. Dotted lines extending from each box represent 1.5× the quartile deviation. Open red circles, outlying cases; closed diamonds, medians; horizontal bars, means.
Page created: July 08, 2011
Page updated: July 08, 2011
Page reviewed: July 08, 2011
The conclusions, findings, and opinions expressed by authors contributing to this journal do not necessarily reflect the official position of the U.S. Department of Health and Human Services, the Public Health Service, the Centers for Disease Control and Prevention, or the authors' affiliated institutions. Use of trade names is for identification only and does not imply endorsement by any of the groups named above.