Volume 17, Number 2—February 2011
Dispatch
School Closures and Student Contact Patterns
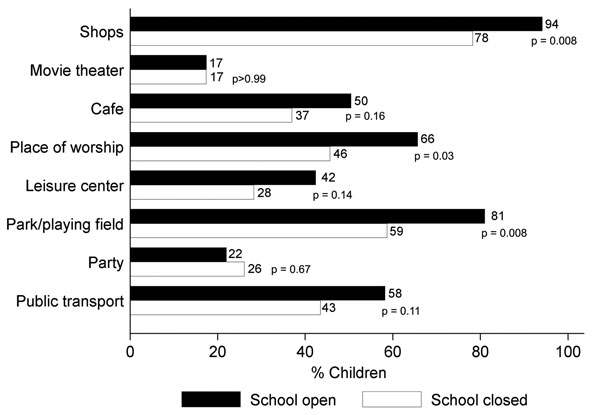
Figure 1

Figure 1. Visits to public places during open and closure periods of a UK secondary school, June–July 2009. Percentage of students visiting public places >1×/week while the school was open (n = 99–103, depending on the place) and while it was closed (n = 46). Numbers after bars show percentages in each group; p values are from Fisher exact tests comparing the proportions during the open versus closed periods.
Page created: July 08, 2011
Page updated: July 08, 2011
Page reviewed: July 08, 2011
The conclusions, findings, and opinions expressed by authors contributing to this journal do not necessarily reflect the official position of the U.S. Department of Health and Human Services, the Public Health Service, the Centers for Disease Control and Prevention, or the authors' affiliated institutions. Use of trade names is for identification only and does not imply endorsement by any of the groups named above.