Volume 17, Number 2—February 2011
Dispatch
School Closures and Student Contact Patterns
Figure 2
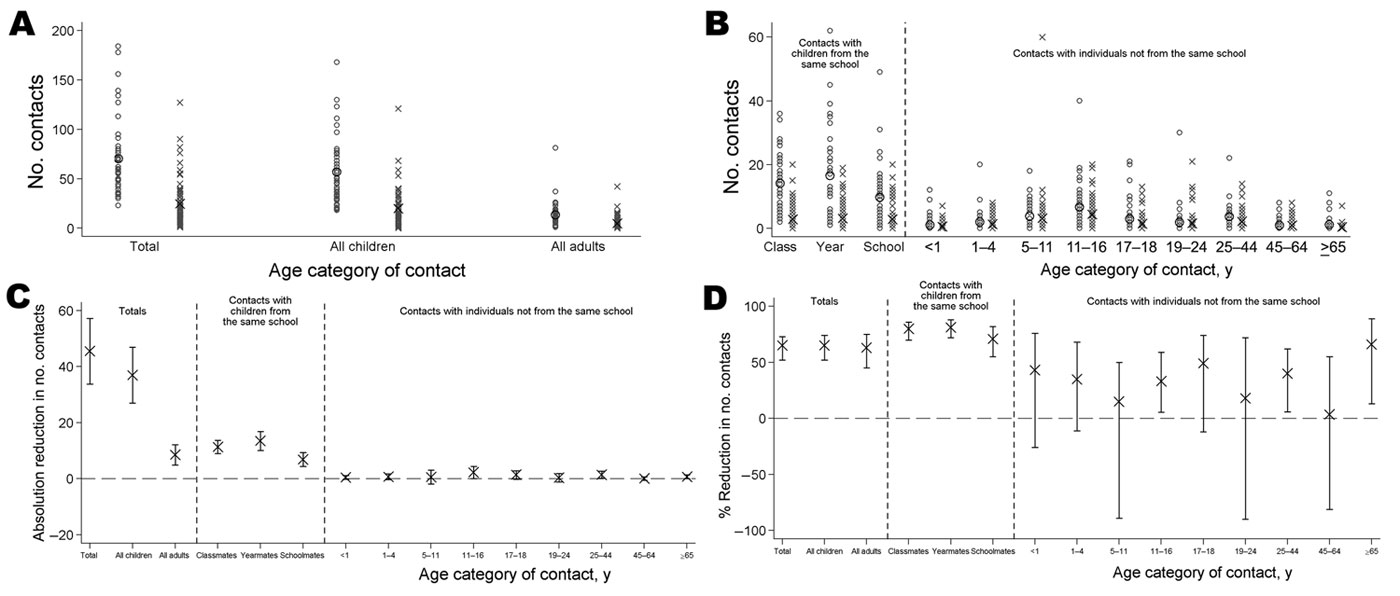
Figure 2. Number of contacts made by students with persons in different categories and the changes associated with school closures. A) total contacts overall and with students and adults; B) contacts with persons in different categories at school and in different age groups outside school; C) absolute reductions in numbers of contacts with persons in different groups associated with school closure; D) relative reductions in numbers of contacts with persons in different groups associated with school closure. In (A) and (B), large black markers indicate the mean number of contacts; small gray markers indicate individual data points; circles indicate data for when the school was open (n = 41), crosses indicate data for when the school was closed (n = 73). In (C) and (D), error bars indicate 95% confidence intervals.