Volume 17, Number 5—May 2011
Research
Molecular Epidemiology of Oropouche Virus, Brazil
Helena Baldez Vasconcelos, Márcio R.T. Nunes, Lívia M.N. Casseb, Valéria L. Carvalho, Eliana V. Pinto da Silva, Mayra Silva, Samir M.M. Casseb, and Pedro F.C. Vasconcelos
Figure 3
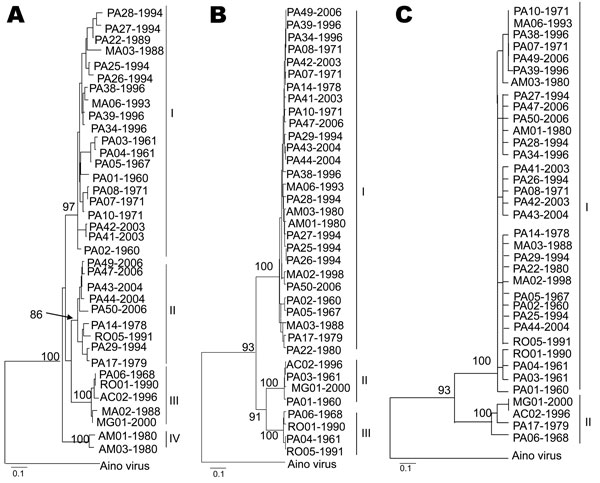
Figure 3. Phylogenetic analysis of 36 Oropouche virus strains: A) N gene (693 nt), B) Gn gene (644 nt), and C) large (L) gene (634 nt), showing different topologies. Bootstrap values obtained by using maximum parsimony and neighbor-joining methods are placed over each main node of the tree corresponding to the phylogenetic groupings. The arrow indicates the exact position of the bootstrap value in the tree. Scale bars indicate 10% nt divergence.
Page created: August 09, 2011
Page updated: August 09, 2011
Page reviewed: August 09, 2011
The conclusions, findings, and opinions expressed by authors contributing to this journal do not necessarily reflect the official position of the U.S. Department of Health and Human Services, the Public Health Service, the Centers for Disease Control and Prevention, or the authors' affiliated institutions. Use of trade names is for identification only and does not imply endorsement by any of the groups named above.