Volume 17, Number 6—June 2011
Dispatch
Macrolide Resistance in Mycoplasma pneumoniae, Israel, 2010
Diana Averbuch, Carlos Hidalgo-Grass, Allon E. Moses, Dan Engelhard, and Ran Nir-Paz
Figure 2
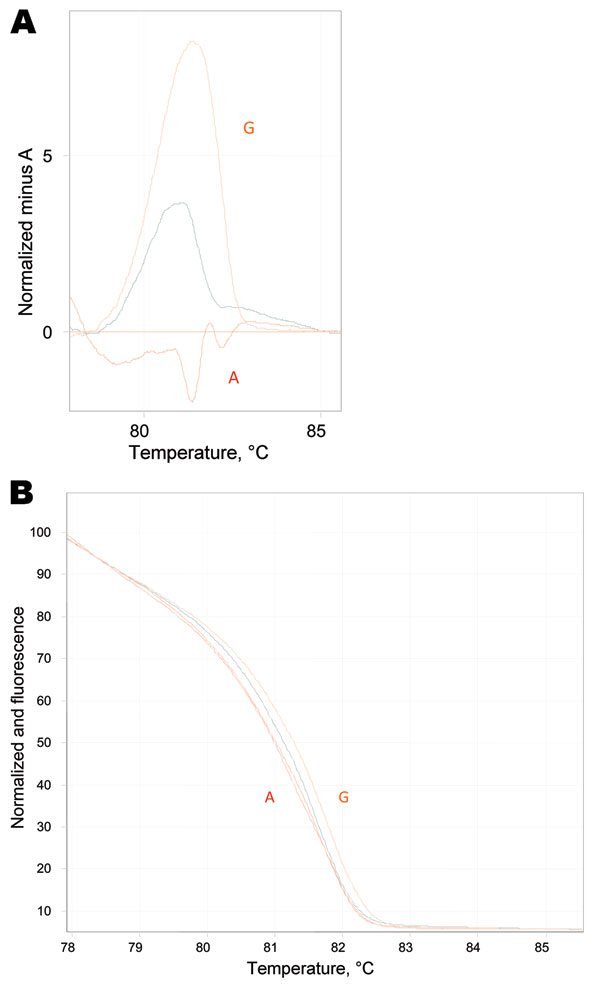
Figure 2. Real-time PCR high-resolution melting assay. A) High-resolution melt profiles are shown for wild-type (WT) Mycoplasma pneumoniae A (A2063A), macrolide resistance mutation G (A2063G) sample, and the mixed genotype sample in the normalized graph mode. B) Temperature-shifted difference graph demonstrates the deviations between WT, resistant, and mixed samples. The WT isolate has been selected to normalize the temperature shift graph and displays the deviation of samples from it.
1These authors contributed equally to this article.
Page created: August 03, 2011
Page updated: August 03, 2011
Page reviewed: August 03, 2011
The conclusions, findings, and opinions expressed by authors contributing to this journal do not necessarily reflect the official position of the U.S. Department of Health and Human Services, the Public Health Service, the Centers for Disease Control and Prevention, or the authors' affiliated institutions. Use of trade names is for identification only and does not imply endorsement by any of the groups named above.