Volume 17, Number 8—August 2011
Research
Incidence of Acute Gastroenteritis and Role of Norovirus, Georgia, USA, 2004–2005
Figure 1
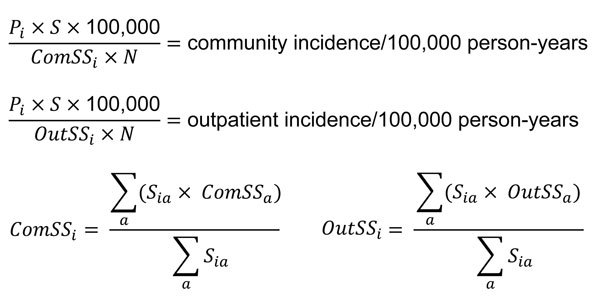
Figure 1. Equations used for calculation of community and outpatient incidence of each pathogen in patients with acute gastroenteritis (AGE), Kaiser Foundation Health Plan of Georgia, Inc., USA, March 15, 2004–March 13, 2005. Pi, prevalence of pathogen i in stool samples; S, total no. stool samples submitted; ComSSi, pathogen-specific fecal specimen submission rates among all respondents with AGE; N, total Kaiser membership; OutSSi, pathogen-specific fecal specimen submission rates among those seeking medical care; Sia, no. of stools positive for pathogen i in age group a; ComSSa, proportion of those in age group a with AGE who seek care and submit stool specimen; OutSSa, proportion of those in age group a seeking care for AGE who submit stool specimen.