Inpatient Capacity at Children’s Hospitals during Pandemic (H1N1) 2009 Outbreak, United States
Marion R. Sills

, Matthew Hall, Evan S. Fieldston, Paul D. Hain, Harold K. Simon, Thomas V. Brogan, Daniel B. Fagbuyi, Michael B. Mundorff, and Samir S. Shah
Author affiliations: Author affiliations: University of Colorado School of Medicine, Aurora, Colorado, USA (M.R. Sills); Children's Hospital Colorado, Aurora (M.R. Sills); Child Health Corporation of America, Shawnee Mission, Kansas, USA (M. Hall); University of Pennsylvania School of Medicine, Philadelphia, Pennsylvania, USA (E.S. Fieldston, S.S. Shah); Children's Hospital of Philadelphia, Philadelphia (E.S. Fieldston, S.S. Shah); Monroe Carell Jr. Children's Hospital at Vanderbilt, Nashville, Tennessee, USA (P.D. Hain); Emory University School of Medicine, Atlanta, Georgia, USA (H.K. Simon); Children's Healthcare of Atlanta, Atlanta (H.K. Simon); Seattle Children’s Hospital, Seattle, Washington, USA (T.V. Brogan); University of Washington School of Medicine, Seattle (T.V. Brogan); The George Washington University School of Medicine, Washington, DC, USA (D.B. Fagbuyi); Children's National Medical Center, Washington (D.B. Fagbuyi); Intermountain Healthcare, Salt Lake City, Utah, USA (M.B. Mundorff)
Main Article
Figure
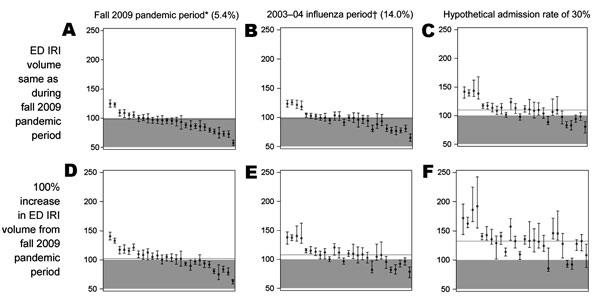
Figure. Predictive model of hospital occupancy during 11-week outbreak of pandemic influenza A (H1N1) 2009 in the United States, by ED IRI admission rate and ED IRI volume, using fall 2009 pandemic period data as baseline. Percentages given indicate hospital admission rate during period or for hypothetical scenario. Gray area indicates 100% occupancy. Each circle represents median occupancy from 1 hospital; vertical whiskers indicate interquartile range. y-axes indicate percentage occupancy; x-axes indicates individual hospitals. Median (interquartile range) occupancy across study hospitals: A) 95.9% (85.0%–100.3%); B) 97.9% (80.5%–102.7%); C) 109.7% (97.9%–117.1%); D) 102.2% (91.7%–112.4%); E) 108.0% (96.4%–114.9%); F) 132.4% (124.5%–145.5%). Letters correspond to scenarios in Table 3. *MMWR reporting weeks 35–45 (September 5–November 20, 2009). †MMWR reporting weeks 44–53 (November 1, 2003–January 9, 2004). ED, emergency department; IRI, influenza-related illness; MMWR, Morbidity and Mortality Weekly Report (Centers for Disease Control and Prevention, Atlanta, GA, USA).
Main Article
Page created: September 06, 2011
Page updated: September 06, 2011
Page reviewed: September 06, 2011
The conclusions, findings, and opinions expressed by authors contributing to this journal do not necessarily reflect the official position of the U.S. Department of Health and Human Services, the Public Health Service, the Centers for Disease Control and Prevention, or the authors' affiliated institutions. Use of trade names is for identification only and does not imply endorsement by any of the groups named above.