Volume 18, Number 11—November 2012
Dispatch
Seroprevalence of Influenza A(H1N1)pdm09 Virus Antibody, England, 2010 and 2011
Figure 1
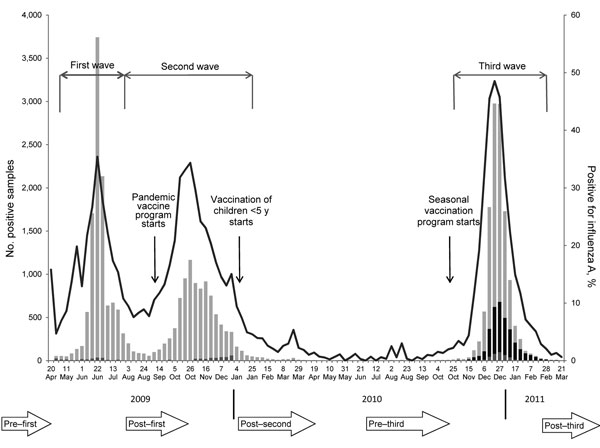
Figure 1. . Number of influenza A(H1N1)pdm09 virus detections (and percentage positive) detected through a network of Health Protection Agency laboratories (the Respiratory DataMart system) from the start of the pandemic in week 17 (week of April 27) 2009 until the end of the 2010–11 winter season. It demonstrates the 3 waves of pandemic influenza activity in summer 2009, autumn 2009, and winter 2010–11 and the key events in relation to the timing of the national influenza vaccination program. The timing of the serum collections are illustrated at the bottom of the figure. Samples were grouped into panels according to their collection. Light gray, A(H1N1)pdm09 virus; medium gray, untyped influenza A virus; black, influenza B virus; line, overall percentage positive. Study periods were defined as follows: pre–first wave, before April 2009; post–first wave, August–October 2009; post–second wave, January–April 2010; pre–third wave, June–October 2010; and post–third wave, February–April 2011.