Volume 18, Number 2—February 2012
Research
Effect of Surveillance Method on Reported Characteristics of Lyme Disease, Connecticut, 1996–2007
Starr-Hope Ertel , Randall S. Nelson, and Matthew L. Cartter
Figure 1
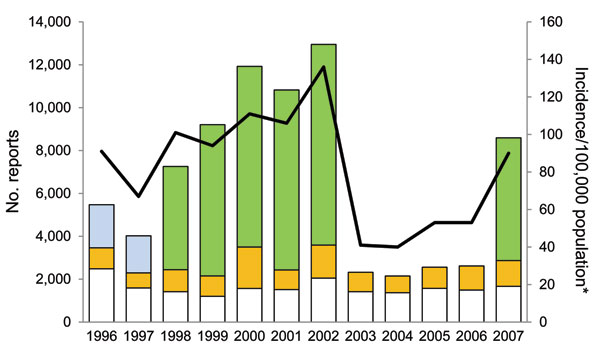
Figure 1. Number of Lyme disease surveillance reports received and incidence per 100,000 population, Connecticut, 1996–2007. White bar sections, passive surveillance; gold bar sections, active surveillance; blue bar sections, enhanced laboratory surveillance; green bar sections, mandatory laboratory surveillance; line, incidence, determined by using decennial census data encompassing the year data were reported.
Page created: January 19, 2012
Page updated: January 19, 2012
Page reviewed: January 19, 2012
The conclusions, findings, and opinions expressed by authors contributing to this journal do not necessarily reflect the official position of the U.S. Department of Health and Human Services, the Public Health Service, the Centers for Disease Control and Prevention, or the authors' affiliated institutions. Use of trade names is for identification only and does not imply endorsement by any of the groups named above.