Volume 18, Number 4—April 2012
Dispatch
Ikoma Lyssavirus, Highly Divergent Novel Lyssavirus in an African Civet1
Figure 2
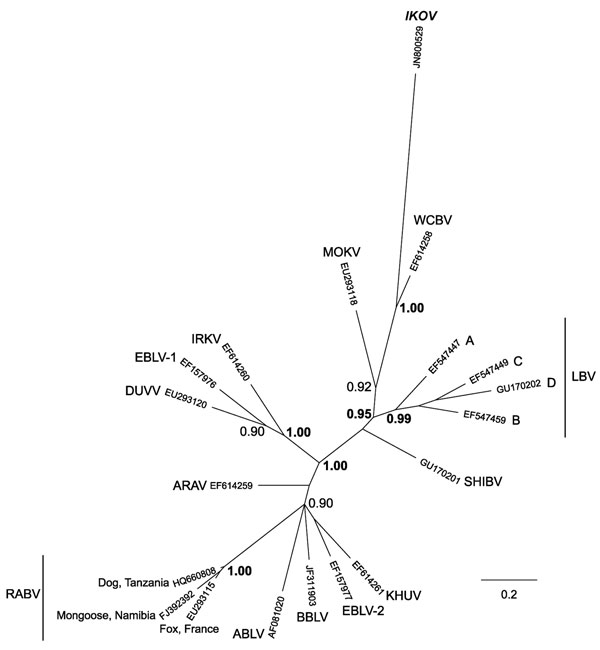
Figure 2. Phylogenetic relationships between all currently identified lyssaviruses compared with Ikoma lyssavirus (IKOV; shown in boldface italics), as determined on the basis of partial nucleoprotein gene sequences (405 bp). Relationships are presented as an unrooted phylogram based on Bayesian Markov chain Monte Carlo (MCMC) analysis. Sequences were aligned by using ClustalX (version 2.0.10; www.clustal.org/clustal2). The MCMC analysis was performed in MrBayes (version 3.1.2; http://mrbayes.sourceforge.net/), by using the general-time reversible model with a proportion of invariable sites and a gamma-shaped distribution of rates across sites, treating values for model parameters as unknown variables with uniform priors to be estimated in each analysis. Analyses were conducted with 2 independent runs initiated with random starting trees without constraints. Four simultaneous MCMC chains (3 heated and 1 cold, according to the default settings) were run for 107 generations; trees were sampled every 100 generations. The first 25,000 trees were discarded as the burn-in phase; the remaining trees were used to estimate consensus phylograms and Bayesian posterior probabilities. MrBayes outputs were examined by using Tracer 1.5 (http://beast.bio.ed.ac.uk/Tracer). The phylogenetic tree was visualized by using FigTree (version 1.3.1; http://beast.bio.ed.ac.uk/FigTree). Posterior probability values represent the degree of support for each node on the tree: only values >0.90 are shown; values >0.95 are shown in boldface. Scale bar indicates branch length, expressed as the expected number of substitutions per site. ARAV, Aravan virus; ABLV, Australian bat lyssavirus; BBLV, Bokeloh bat lyssavirus; DUVV, Duvenhage virus; EBLV-1 and EBLV-2, European bat lyssavirus type 1 and 2; IRKV, Irkut virus; KHUV, Khujand virus; LBV, Lagos bat virus (lineages A, B, C and D); MOKV, Mokola virus; RABV, rabies virus; SHIBV, Shimoni bat virus; WCBV, West Caucasian bat virus.
1These data were presented in part at the XXII Rabies in the Americas meeting in San Juan, Puerto Rico, October 16–21, 2011.