Comparison of Escherichia coli ST131 Pulsotypes, by Epidemiologic Traits, 1967–2009
James R. Johnson

, Marie-Hélène Nicolas-Chanoine, Chitrita DebRoy, Mariana Castanheira, Ari Robicsek, Glen Hansen, Scott Weissman, Carl Urban, Joanne Platell, Darren Trott, George Zhanel, Connie Clabots, Brian D. Johnston, Michael A. Kuskowski, and the MASTER Investigators
Author affiliations: Veterans Affairs Medical Center, Minneapolis, Minnesota, USA (J.R. Johnson, C. Clabots, B.D. Johnston, M.A. Kuskowski); University of Minnesota, Minneapolis (J.R. Johnson, B.D. Johnston, M.A. Kuskowski); Hôpital Beaujon, Clichy, France (M.-H. Nicolas-Chanoine); The Pennsylvania State University, College Park, Pennsylvania, USA (C. DebRoy); JMI Laboratories, North Liberty, Iowa, USA (M. Castanheira); NorthShore University HealthSystem, Evanston, Illinois, USA (A. Robicsek); Hennepin County Medical Center, Minneapolis (G. Hansen); University of Washington, Seattle, Washington, USA (S. Weissman); New York Hospital Queens, Flushing, New York, USA (C. Urban); New York University School of Medicine, New York, New York, USA (C. Urban); University of Queensland, Brisbane, Queensland, Australia (J. Platell); University of Adelaide, Adelaide, South Australia, Australia (D. Trott); University of Manitoba, Winnipeg, Manitoba, Canada (G. Zhanel)
Main Article
Figure A1

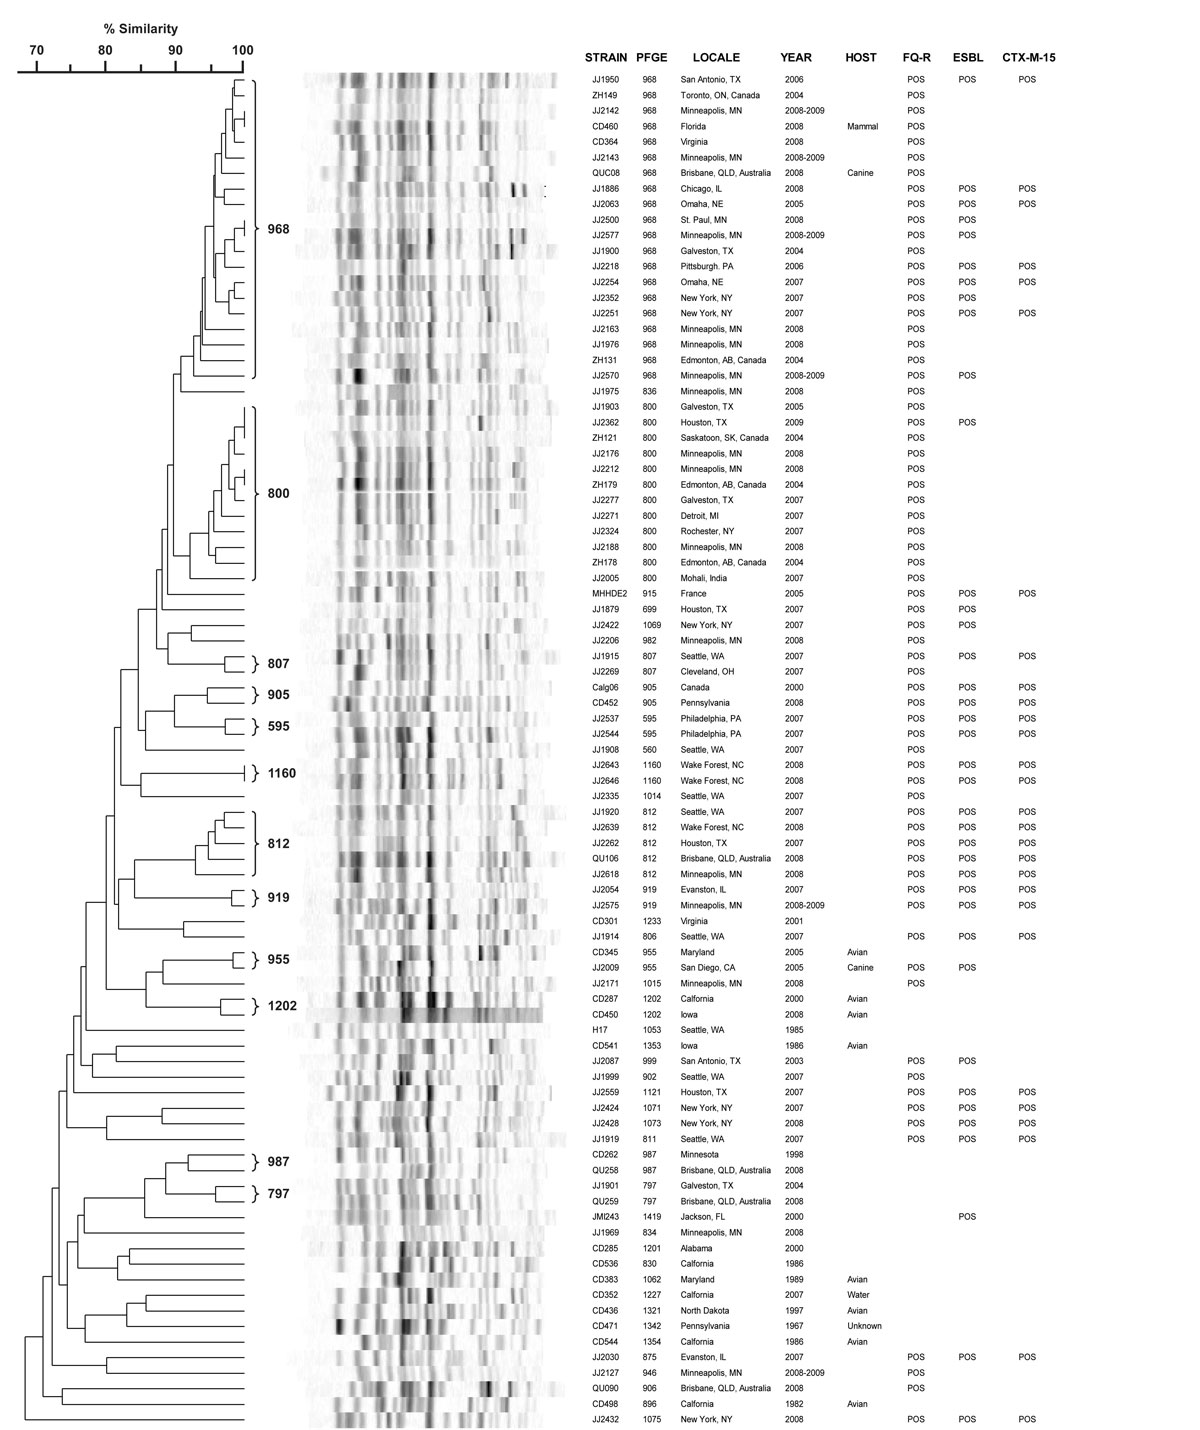
Figure A1. Pulsed-field gel electrophoresis profile dendrogram of 87 diverse isolates of Escherichia coli ST131. Isolates for the dendrogram, which represent a 15% subsample of the total population (n = 579), were selected randomly after deliberate inclusion of 2 representatives of each pulsotype with >6 members (indicated by brackets) plus the earliest previously reported isolate (from 1985) and the earliest present isolate (from 1967). YEAR, year of isolation or submission to reference laboratory; FQ-R, fluoroquinolone-resistant; ESBL, extended-spectrum β-lactamase; CTX-M-15, presence of blaCTX-M-15 (as detected by PCR); POS, positive (i.e., trait present); 2008–2009, interval during which isolate was collected. Scale is percent profile similarity.
Main Article
Page created: March 15, 2012
Page updated: March 15, 2012
Page reviewed: March 15, 2012
The conclusions, findings, and opinions expressed by authors contributing to this journal do not necessarily reflect the official position of the U.S. Department of Health and Human Services, the Public Health Service, the Centers for Disease Control and Prevention, or the authors' affiliated institutions. Use of trade names is for identification only and does not imply endorsement by any of the groups named above.
