Volume 18, Number 7—July 2012
Dispatch
Changing Socioeconomic Indicators of Human Plague, New Mexico, USA
Figure
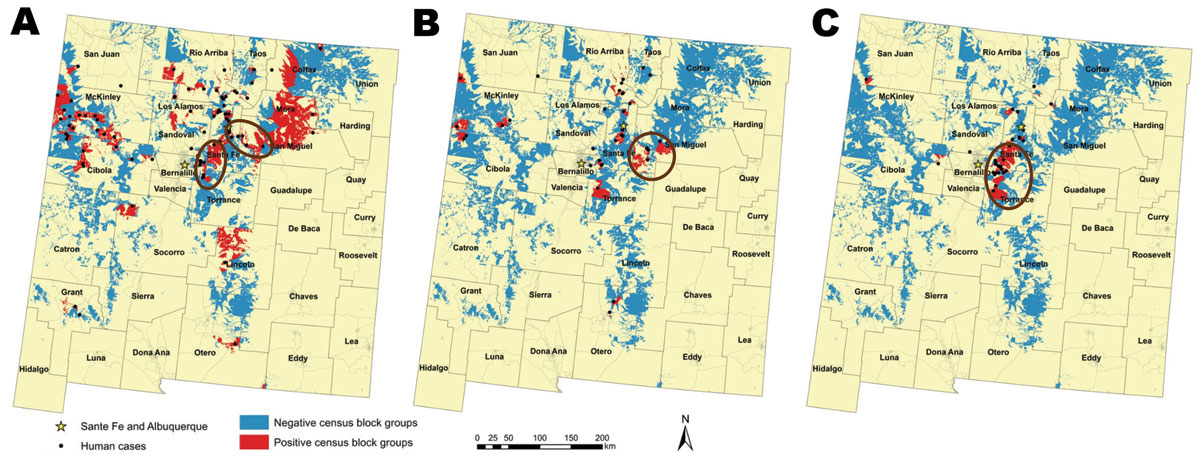
Figure. . . . Areas of New Mexico, USA, considered in the current analysis on the basis of those defined as high risk for human plague by Eisen et al. (6) for each time frame examined. A) 1976–1985, B) 1986–1995, C) 1996–2007. Distributions of human cases are displayed and census block groups are color coded as negative or positive for plague cases. Census block group boundaries are indicated in light gray, and counties are outlined in dark gray. Ovals or circle indicate census block groups with significantly (p<0.05) high human plague incidence rates per 1,000 persons, identified by using the Kulldorff space scan statistic (9). Analyses were conducted by using the Poisson probability model and 999 Monte Carlo replications to test for significance.
References
- Centers for Disease Control and Prevention. Summary of notifiable diseases—United States, 2009. MMWR Morb Mortal Wkly Rep. 2011;58:1–100.PubMedGoogle Scholar
- Centers for Disease Control and Prevention. Human plague—four states, 2006. MMWR Morb Mortal Wkly Rep. 2006;55:940–3.PubMedGoogle Scholar
- Craven RB, Maupin GO, Beard ML, Quan TJ, Barnes AM. Reported cases of human plague infections in the United States, 1970–1991. J Med Entomol. 1993;30:758–61.PubMedGoogle Scholar
- Gage KL, Kosoy MY. Natural history of plague: perspectives from more than a century of research. Annu Rev Entomol. 2005;50:505–28. DOIPubMedGoogle Scholar
- Kartman L. Historical and oecological observations on plague in the United States. Trop Geogr Med. 1970;22:257–75.PubMedGoogle Scholar
- Eisen RJ, Reynolds PJ, Ettestad P, Brown T, Enscore RE, Biggerstaff BJ, Residence-linked human plague in New Mexico: a habitat-suitability model. Am J Trop Med Hyg. 2007;77:121–5.PubMedGoogle Scholar
- Barnes AM. Surveillance and control of bubonic plague in the united States. Symposium of the Zoological Society of London. 1981;50:237–70.
- Mann JM, Martone WJ, Boyce JM, Kaufmann AF, Barnes AM, Weber NS. Endemic human plague in New Mexico: risk factors associated with infection. J Infect Dis. 1979;140:397–401. DOIPubMedGoogle Scholar
- Kulldorff M. A spatial scan statistic. Comm Statist Theory Methods. 1997;26:1481–96. DOIGoogle Scholar
- Kulldorff M. Information Management Services, Inc., 2011. SaTScan™ v9.1.1: software for the spatial and space-time scan statistics [cited 2012 Apr 6]. www.satscan.org
- Enscore RE, Biggerstaff BJ, Brown TL, Fulgham RF, Reynolds PJ, Engelthaler DM, Modeling relationships between climate and the frequency of human plague cases in the southwestern United States, 1960–1997. Am J Trop Med Hyg. 2002;66:186–96.PubMedGoogle Scholar
1Current affiliation: Marshfield Clinic Research Foundation, Marshfield, Wisconsin, USA.