Volume 18, Number 8—August 2012
Letter
Usefulness of School Absenteeism Data for Predicting Influenza Outbreaks, United States
Figure
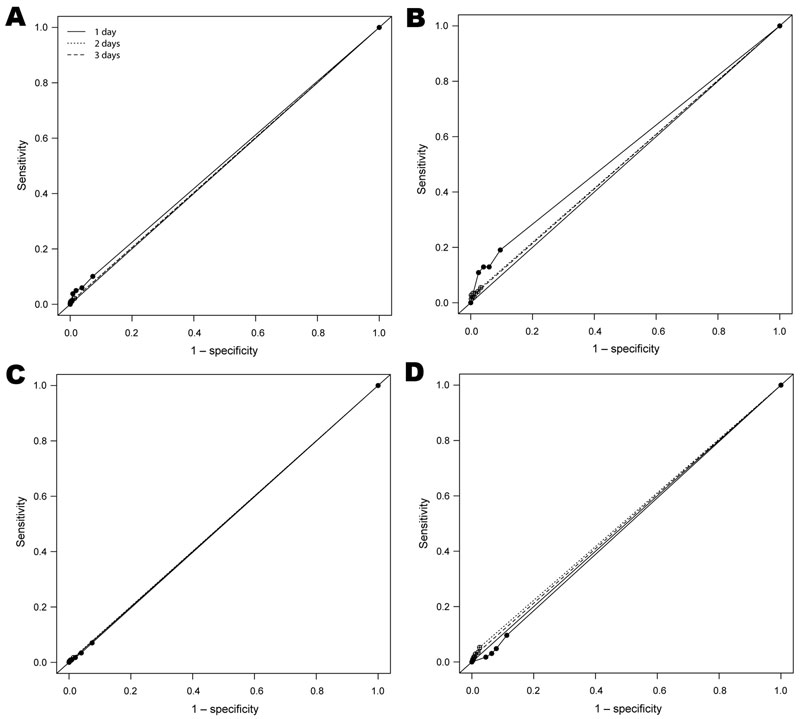
Figure. . Receiver operating characteristic (ROC) curves showing A) predictive ability of school absenteeism to detect an outbreak (z-score ≥3) of fever/influenza for the entire study period; B) fever/influenza for the pandemic (H1N1) 2009 period; C) absenteeism for the entire study period; and D) absenteeism for the pandemic (H1N1) 2009 period. ROC curves were based on observations of whether 4 absentee threshold z-score levels—1, 1.5, 2, or 2.5—were reached or exceeded for either 1 day, 2 consecutive days, or 3 consecutive days as a predictor of the school district outbreak status during the next 7 days. In the ROC curves, sensitivity on the y-axis indicates the true-positive rate, and 1– specificity on the x-axis indicates the false-positive rate. The study was conducted September 6, 2005–June 26, 2009, in New York City, New York, USA.
1Current affiliation: SciMetrika, LLC, Research Triangle Park, North Carolina, USA.